1.3.1: Where Are All of These Mines? Continued
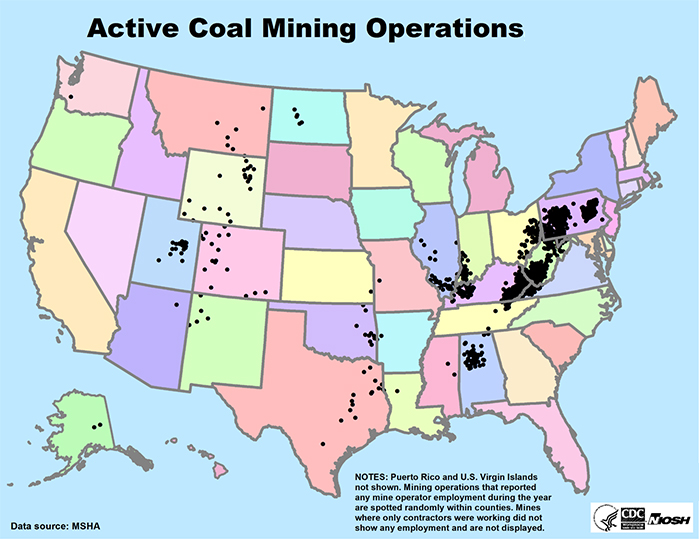
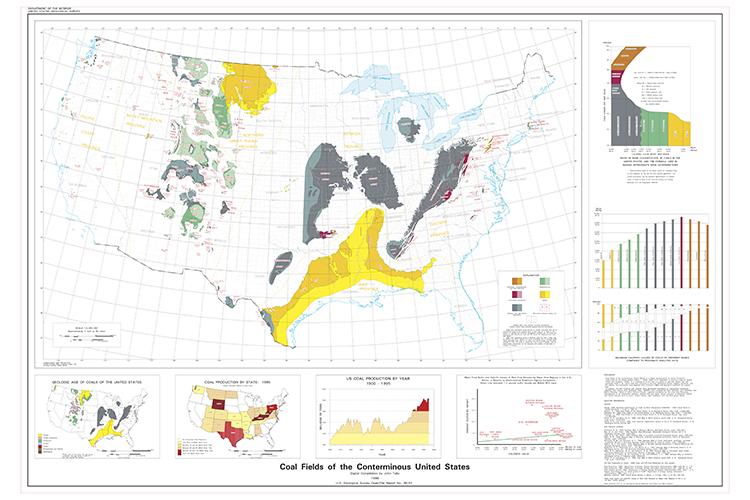
Next, let’s look at the fuel minerals, and specifically coal. After looking at Figure 1.3.7, examine the USGS map of U.S. coalfields in Figure 1.3.8. Do you see the correspondence between the coalfields and the location of coal mines? There is a lot of detail to be gleaned from this figure, and I suggest you zoom in and take a closer look. Take note of the rank of the coal found in the different coalfields, and also note the relatively few locations in which metallurgical-grade coal is found.
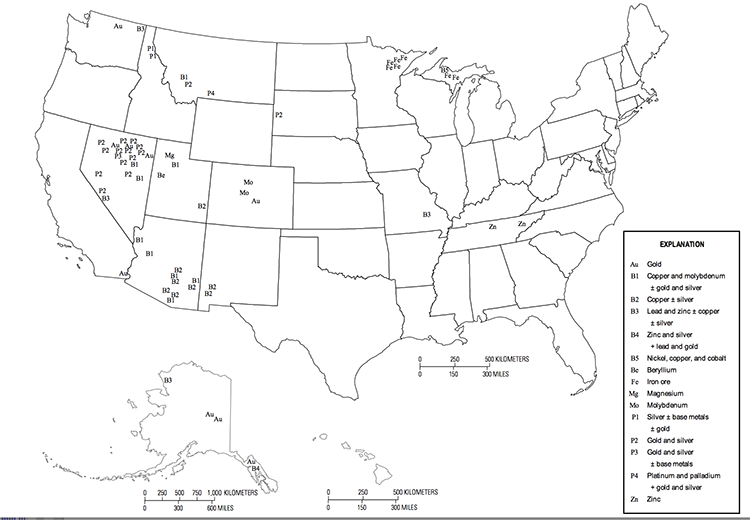
These figures that we’ve just examined are helpful as we endeavor to learn major characteristics of the U.S. mining industry. There are many ways to “slice and dice” the available data, depending on your specific interests. In this lesson, I want to look at a few additional representations. The first is to break out in more detail the major metal and nonmetal (industrial mineral) mining regions by commodity. Figure 1.3.9 details the locations of 15 metal commodities. Note that in many cases each commodity label represents multiple mines in that location.
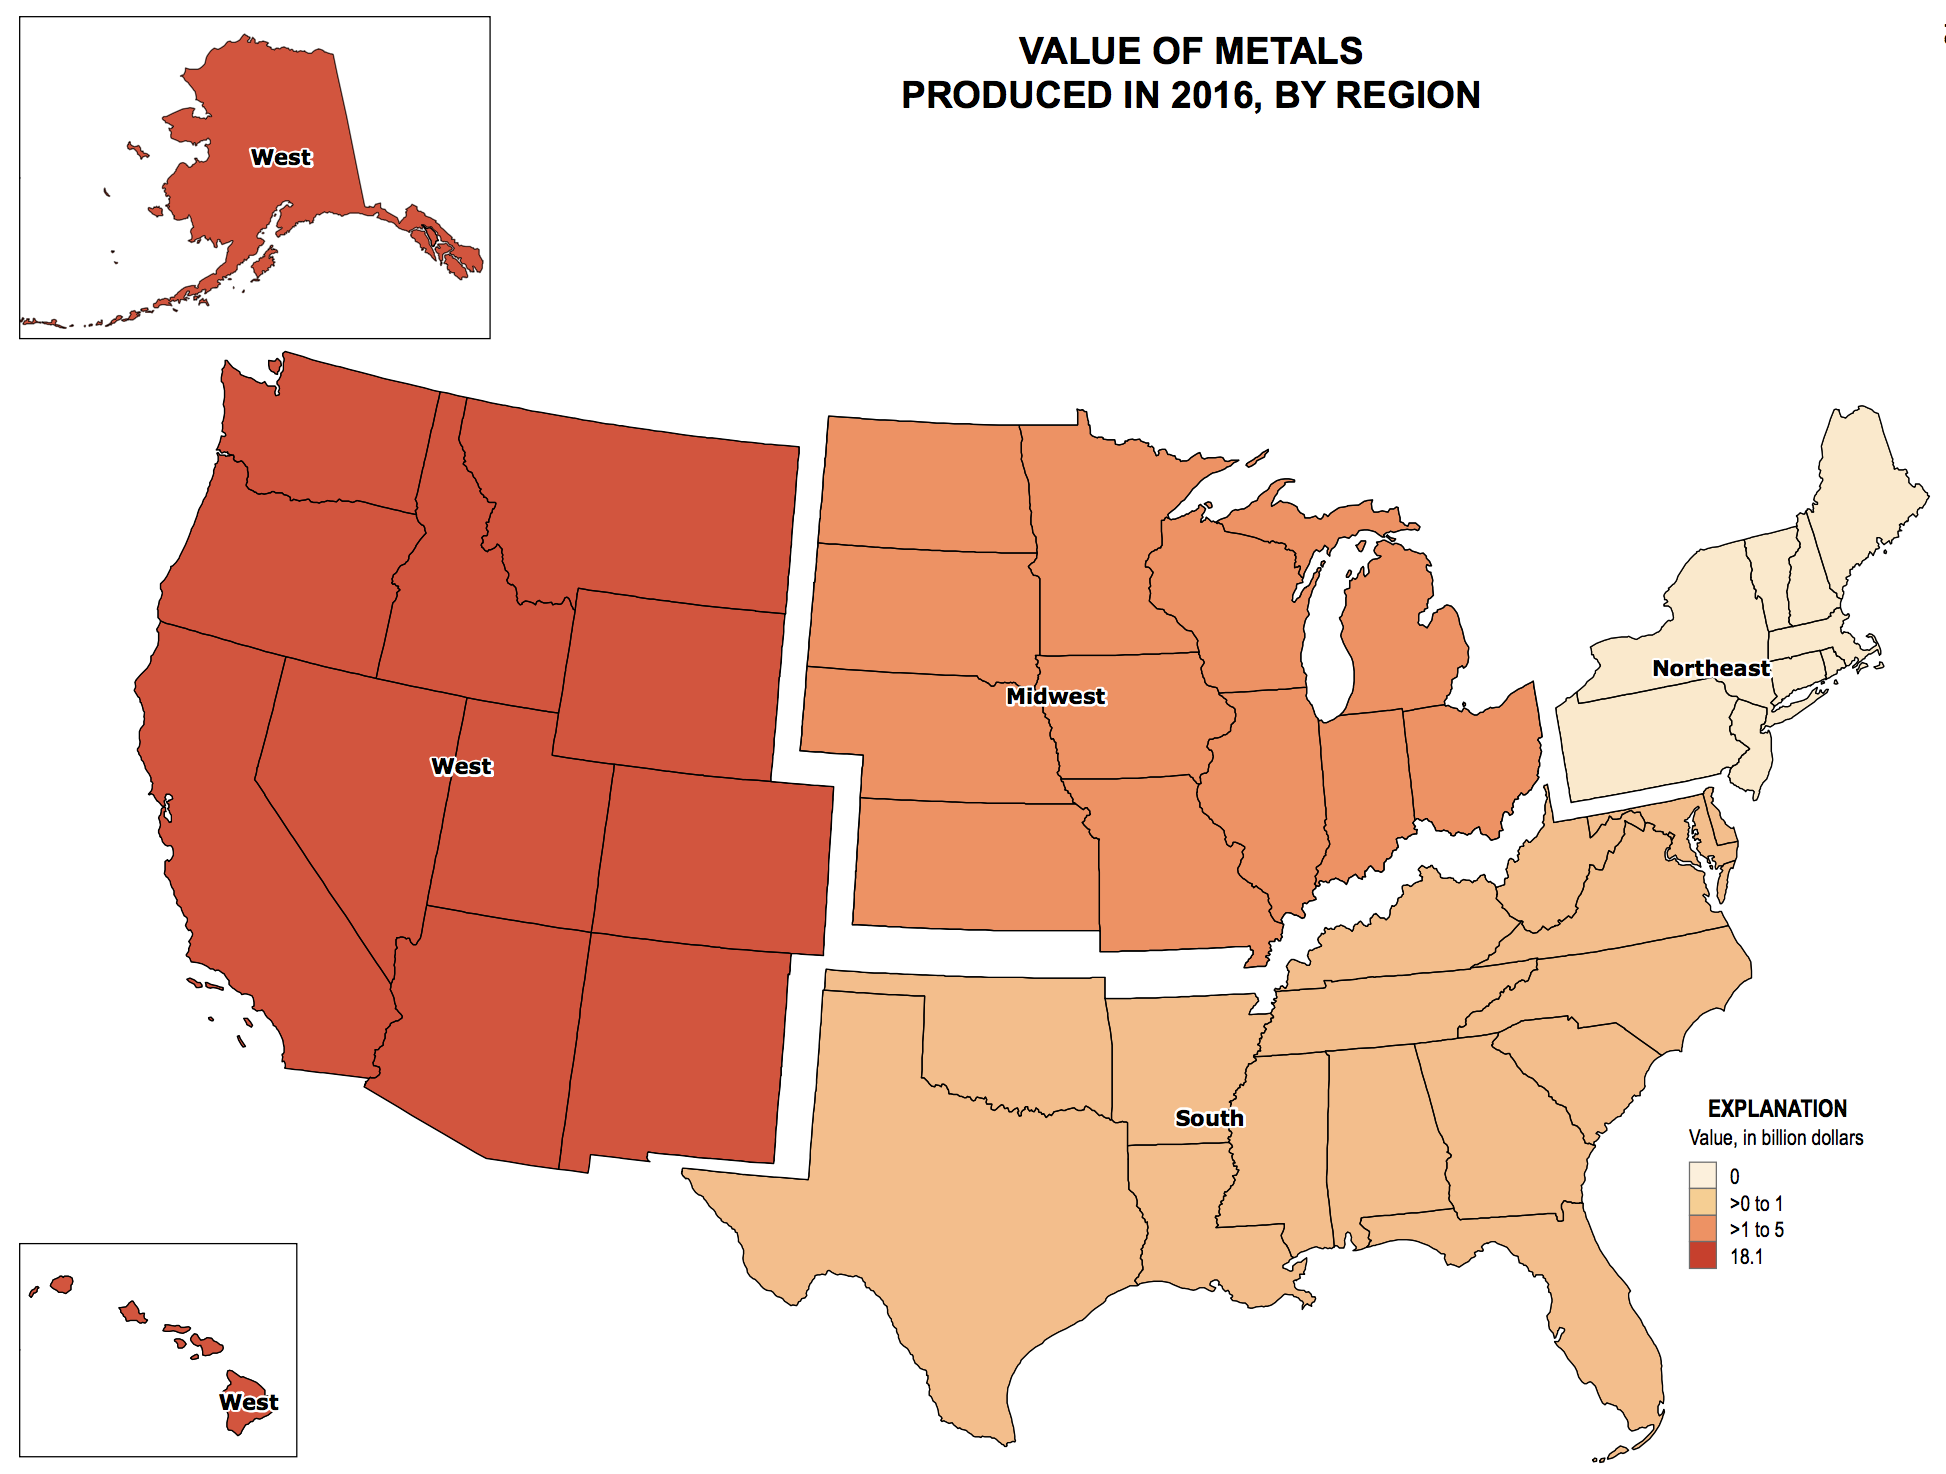
The second representation that I want to introduce here is the relative economic value or significance of mining in specific regions. The economic value of metals mined in the U.S. is shown by region in Figure 1.3.10.
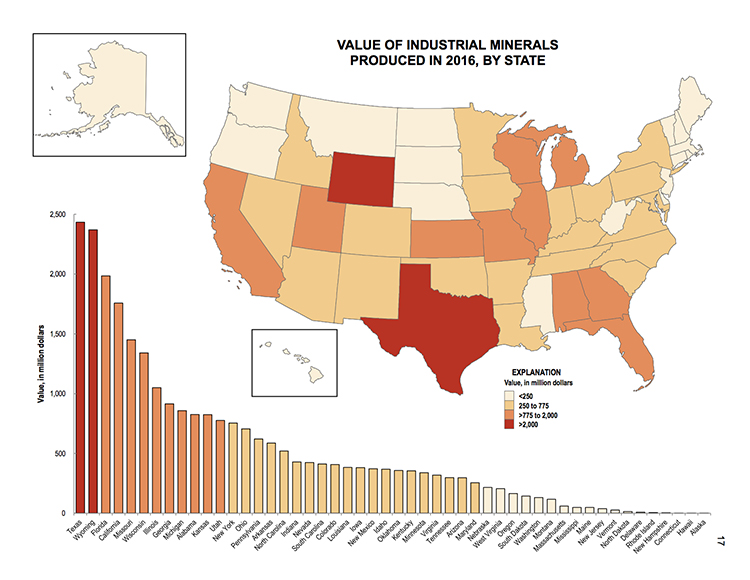
We can examine industrial minerals in the same fashion, starting this time with the economic value of industrial minerals production by state, as shown in Figure 1.3.11.