You hear the word "scale" often when you work around people who produce or use geographic information. If you listen closely, you will notice that the term has several different meanings, depending on the context in which it is used. You will hear talk about the scales of geographic phenomena and about the scales at which phenomena are represented on maps. You may even hear the word used as a verb, as in "scaling a map" or "downscaling." The goal of this section is for you to learn to tell these different meanings apart, and to be able to use concepts of scale to help make sense of geographic data.
2.1.1 Scope or Extent
Often "scale" is used as a synonym for "scope," or "extent." For example, the title of the article “Contractors Are Accused in Large-Scale Theft of Food Aid in Somalia,” uses the term "large scale" to describe a widespread theft of food aid. This usage is common among the public. The term scale can also take on other meanings.
2.1.2 Measurement
The word "scale" can also be used as a synonym for a ruler--a measurement scale. Because data consist of symbols that represent measurements of phenomena, it is important to understand the reference systems used to take the measurements in the first place. In this section, we will consider a measurement scale known as the geographic coordinate system that is used to specify positions on the Earth's roughly spherical surface. In other sections, we will encounter two-dimensional (plane) coordinate systems, as well as the measurement scales used to specify attribute data.
2.1.3 Map Scale
Map scale is the proportion between a distance on a map and a corresponding distance on the ground (Dm / Dg). By convention, the proportion is expressed as a representative fraction in which map distance (Dm) is always reduced to 1. The representative fraction 1:100,000, for example, means that a section of road that measures 1 unit in length on a map stands for a section of road on the ground that is 100,000 units long. A representative fraction is unit-less, it has the same meaning if we are measuring on the map in inches, centimeters, or any other unit (in this example, the portion of the world represented on the map is 100,000 times as big as the map’s representation). If we were to change the scale of the map such that the length of the section of road on the map was reduced to, say, 0.1 units in length, we would have created a smaller-scale map whose representative fraction is 0.1:100,000, or 1:1,000,000.
2.1.4 Graphic Scales
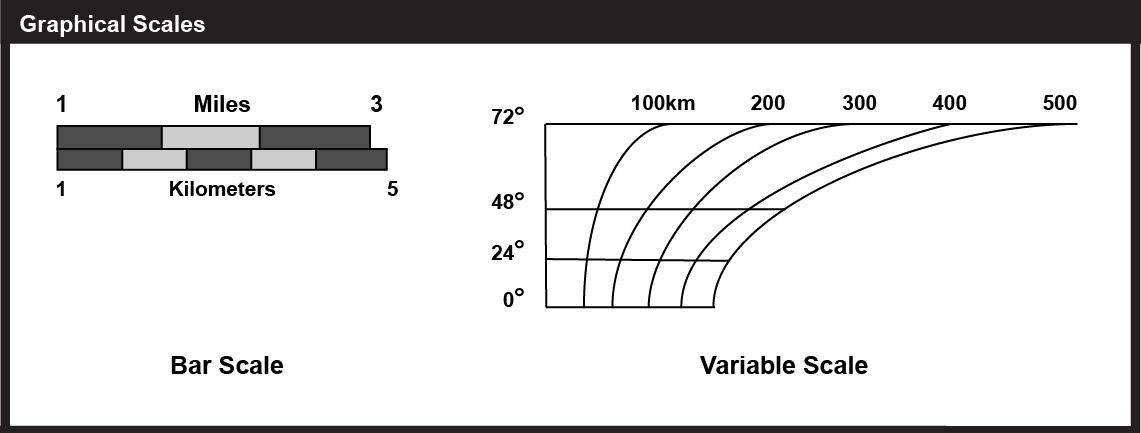
Another way to express map scale is with a graphic (or "bar") scale (Figure 2.1). Unlike representative fractions, graphic scales remain true when maps are shrunk or magnified, thus they are especially useful on web maps where it is impossible to predict the size at which users will view them. Most maps include a bar scale like the one shown above left. Some also express map scale as a representative fraction. The implication in either case is that scale is uniform across the map. However, except for maps that show only very small areas, scale varies across every map. This follows from the fact that positions on the nearly spherical Earth must be transformed to positions on two-dimensional sheets of paper. Systematic transformations of the world (or parts of it) to flat maps are called map projections. As we will discuss in greater depth later in this chapter, all map projections are accompanied by deformation of features in some or all areas of the map. This deformation causes map scale to vary across the map. Representative fractions typically, therefore, specify map scale along a line at which deformation is minimal (nominal scale). We will discuss nominal scale in further detail later. Bar scales, also, generally denote only the nominal or average map scale. An alternative to a simple bar scale that accounts for map distortion is a variable scale. Variable scales, like the one illustrated above right, show how scale varies, in this case by latitude, due to deformation caused by map projection.
2.1.5 Changing a Map's Size
As noted above, another way that the term "scale" is used is as a verb. To ‘scale a map’ is to reproduce it at a different size. For instance, if you photographically reduce a 1:100,000-scale map to 50 percent of its original width and height, the result would be one-quarter the area of the original. Obviously, the map scale of the reduction would be smaller too: 1/2 x 1/100,000 = 1/200,000 (or a representative fraction scale specification of 1:200,000). Because of the inaccuracies inherent in all geographic data, scrupulous geographic information specialists avoid enlarging source maps. To do so is to exaggerate generalizations and errors.
In the following sections, you will learn more about the process of converting the three-dimensional Earth into a two-dimensional visual representation, the map. As you move through the chapter, keep in mind the different meanings for the term "scale" and think about how it relates to the process of map creation.
Practice Quiz
Registered Penn State students should return now to the Chapter 2 folder in Canvas to take a self-assessment quiz about the Map Scale.
You may take practice quizzes as many times as you wish. They are not scored and do not affect your grade in any way.