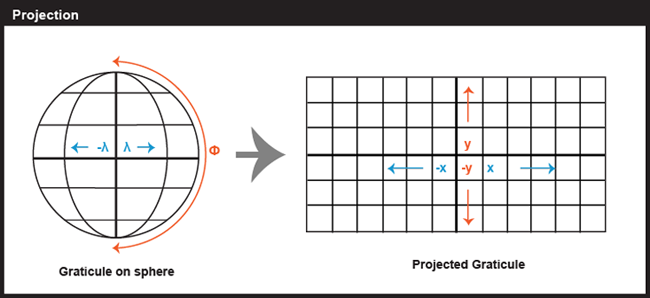
Latitude and longitude coordinates specify positions in a spherical grid called the graticule (that approximates the more-or-less spherical Earth). The true geographic coordinates called unprojected coordinate in contrast to plane coordinates, like the Universal Transverse Mercator (UTM) and State Plane Coordinates (SPC) systems, that denote positions in flattened grids. These georeferenced plane coordinates are referred to as projected. The mathematical equations used to project latitude and longitude coordinates to plane coordinates are called map projections. Inverse projection formulae transform plane coordinates to geographic. The simplest kind of projection, illustrated below, transforms the graticule into a rectangular grid in which all grid lines are straight, intersect at right angles, and are equally spaced. Projections that are more complex yield grids in which the lengths, shapes, and spacing of the grid lines vary. Even this simplest projection produces various kinds of distortions; thus it is necessary to have multiple types of projections to avoid specific types of distortions. Imagine the kinds of distortion that would be needed if you sliced open a soccer ball and tried to force it to be completely flat and rectangular with no overlapping sections. That is the amount of distortion we have in the simple projection below (one of the more common in web maps of the world today).
Many types of map projections have been devised to suit particular purposes. The term "projection" implies that the ball-shaped net of parallels and meridians is transformed by casting its shadow upon some flat, or flattenable, surface. While almost all map projection methods are created using mathematical equations, the analogy of an optical projection onto a flattenable surface is useful as a means to classify the bewildering variety of projection equations devised over the past two thousand years or more.
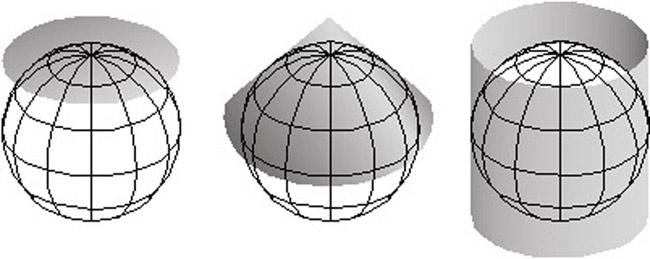
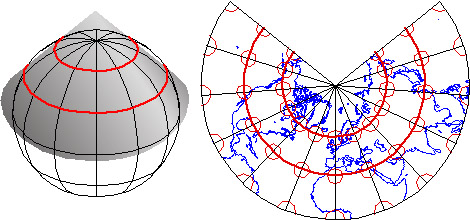
There are three main categories of map projection, those in which projection is directly onto a flat plane, those onto a cone sitting on the sphere that can be unwrapped, and other onto a cylinder around the sphere that can be unrolled (Figure 15 above). All three are shown in their normal aspects. The plane often is centered upon a pole. The cone is typically aligned with the globe such that its line of contact (tangency) coincides with a parallel in the mid-latitudes. Moreover, the cylinder is frequently positioned tangent to the equator (unless it is rotated 90°, as it is in the Transverse Mercator projection). As you might imagine, the appearance of the projected grid will change quite a lot depending on the type of surface it is projected onto, how that surface is aligned with the globe, and where that imagined light is held. The following illustrations show some of the projected graticules produced by projection equations in each category.
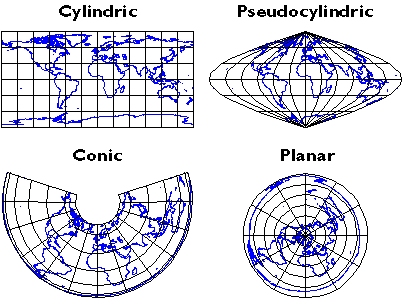
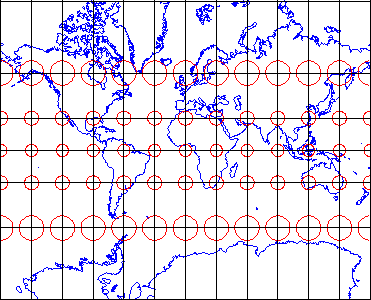
Cylindric projection equations yield projected graticules with straight meridians and parallels that intersect at right angles. The example shown above is a Cylindrical Equidistant (also called Plate Carrée or geographic) in its normal equatorial aspect.
Pseudocylindric projections are variants on cylindrics in which meridians are curved. The result of a Sinusoidal projection is shown above.
Conic projections yield straight meridians that converge toward a single point at the poles, parallels that form concentric arcs. The example shown above is the result of an Albers Conic Equal Area, which is frequently used for thematic mapping of mid-latitude regions.
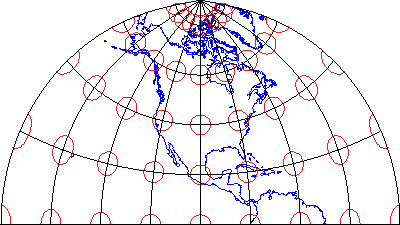
Planar projections also yield meridians that are straight and convergent, but parallels form concentric circles rather than arcs. Planar projections are also called azimuthal because every planar projection preserves the property of azimuthality, directions (azimuths) from one or two points to all other points on the map. The projected graticule shown above is the result of an Azimuthal Equidistant projection in its normal polar aspect.
Appearances can be deceiving. It is important to remember that the look of a projected graticule depends on several projection parameters, including latitude of projection origin, central meridian, standard line(s), and others. Customized map projections may look entirely different from the archetypes described above (Figure 16).
To help interpret the wide variety of projections, it is necessary to become familiar with Spatial Reference Information that traditionally accompanies a map. There are several terms that you must understand to read the Spatial Reference Information. First, the projection name identifies which projection was used. With this information, you get an understanding of the projection category and the geometric properties the projection preserves. Next, the central meridian is the location of the central longitude meridian. The Latitude of Projection defines the origin of latitude for the projection. There are three common aspects that we can define: polar (projections centered on a pole), equatorial (usually cylindrical or pseudo-cylindrical projections aligned with the equator), and oblique (those centered on any other place). Scale Factor at Central Meridian is the ratio of map scale along the central meridian and the scale at a standard meridian, where scale distortion is zero. Finally, some projections, including the Lambert Conic Conformal, include parameters by which you can specify one or two standard lines along which there is no scale distortion.
2.3.1 Map Projections: Distortion
No projection allows us to flatten the globe without distorting it. Distortion ellipses help us to visualize what type of distortion a map projection has caused, how much distortion occurred, and where it occurred. The ellipses show how imaginary circles on the globe are deformed because of a particular projection. If no distortion had occurred in the process of projecting the map shown below, all of the ellipses would be the same size, and circular in shape.
When positions on the graticule are transformed to positions on a projected grid, four types of distortion can occur: distortion of sizes, angles, distances, and directions. Map projections that avoid one or more of these types of distortion are said to preserve certain properties of the globe: equivalence, conformality, equidistance, and azimuthality, respectively. Each is described below.
2.3.1.1 Equivalence
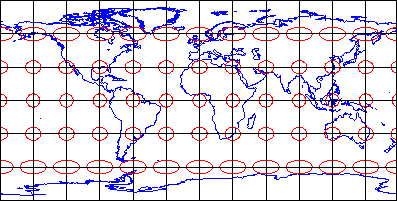
So-called equal-area projections maintain correct proportions in the sizes of areas on the globe and corresponding areas on the projected grid (allowing for differences in scale, of course). Notice that the shapes of the ellipses in the Cylindrical Equal Area projection above are distorted, but the areas each one occupies are equivalent. Equal-area projections are preferred for small-scale thematic mapping (discussed in the next chapter), especially when map viewers are expected to compare sizes of area features like countries and continents.
2.3.1.2 Conformality
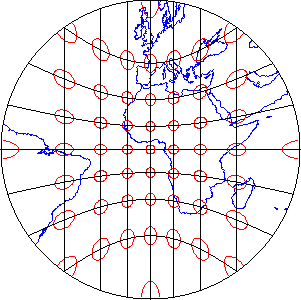
The distortion ellipses plotted on the conformal projection shown above vary substantially in size, but are all the same circular shape. The consistent shapes indicate that conformal projections preserve the fidelity of angle measurements from the globe to the plane. In other words, an angle measured by a land surveyor anywhere on the Earth's surface can be plotted at its corresponding location on a conformal projection without distortion. This useful property accounts for the fact that conformal projections are almost always used as the basis for large scale surveying and mapping. Among the most widely used conformal projections are the Transverse Mercator, Lambert Conformal Conic, and Polar Stereographic.
Conformality and equivalence are mutually exclusive properties. Whereas equal-area projections distort shapes while preserving fidelity of sizes, conformal projections distort sizes in the process of preserving shapes.
As discussed above in section 2.2.4, SPC zones that trend west to east (including Pennsylvania's) are based on unique Lambert Conformal Conic projections. Instead of the cylindrical projection surface used by projections like the Mercator shown above, the Lambert Conformal Conic and map projections like it employ conical projection surfaces like the one shown below. Notice the two lines at which the globe and the cone intersect. Both of these are standard lines; specifically, standard parallels. The latitudes of the standard parallels selected for each SPC zones minimize scale distortion throughout that zone.
2.3.1.3 Equidistance
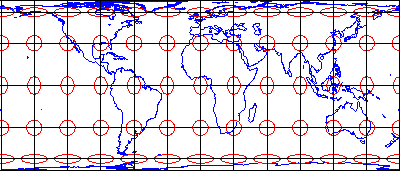
Equidistant map projections allow distances to be measured accurately along straight lines radiating from one or, at most, two points or they can have correct distance (thus maintain scale) along one or more lines. In the example below (also sometimes called an "equirectangular" projection because the parallels and meridians are both equally spaced). Notice that ellipses plotted on the Cylindrical Equidistant (Plate Carrée) projection shown above vary in both shape and size. The north-south axis of every ellipse is the same length, however. This shows that distances are true-to-scale along every meridian; in other words, the property of equidistance on this map projection is preserved from the two poles.
2.3.1.4 Azimuthality
Azimuthal projections preserve directions (azimuths) from one or two points to all other points on the map. Gnomonic projections, like the one above, display all great circles as straight lines. A great circle is the most direct path between two locations across the surface of the globe. See how the ellipses plotted on the gnomonic projection shown above vary in both size and shape, but are all oriented toward the center of the projection? In this example, that is the one point at which directions measured on the globe are not distorted on the projected graticule. This is a good projection for uses like plotting airline connections from one airport to all others.
2.3.1.5 Compromise
Some map projections preserve none of the properties described above, but instead seek a compromise that minimizes distortion of all kinds. The example shown above is the Polyconic projection, where parallels are all non-concentric circular arcs, except for a straight equator, and the centers of these circles lie along a central axis. The U.S. Geological Survey used the polyconic projection for many years as the basis of its topographic quadrangle map series until the conformal Transverse Mercator succeeded it. Another example is the Robinson projection, which is often used for small-scale thematic maps of the world (it was used as the primary world map projection by the National Geographic Society from 1988-1997, then replaced with another compromise projection, the Winkel Tripel; thus, the latter has become common in textbooks).
Try This: Album of Map Projections
John Snyder and Phil Voxland (1994) published an Album of Map Projections that describes and illustrates many more examples in each projection category. Excerpts from that important work are included in our Interactive Album of Map Projections, which registered students will use to complete Project 1. The Interactive Album is available at the PSU Interactive Album of Map Projections.Flex Projector is a free, open source software program developed in Java that supports many more projections and variable parameters than the Interactive Album. Bernhard Jenny of the Institute of Cartography at ETH Zurich created the program with assistance from Tom Patterson of the US National Park Service. You can download Flex Projector from FlexProjector.com
Those who wish to explore map projections in greater depth than is possible in this course might wish to visit an informative page published by the International Institute for Geo-Information Science and Earth Observation (Netherlands), which is known by the legacy acronym ITC. The page is available at Kartoweb Map Projections.
Practice Quiz
Registered Penn State students should return now to the Chapter 2 folder in Canvas to take a self-assessment quiz about the Map Projections.
You may take practice quizzes as many times as you wish. They are not scored and do not affect your grade in any way.