You know that the Earth is not flat; but, as we have implied already, it is not spherical either! For many purposes, we can ignore the variation from a sphere; but, if accuracy matters, the Earth is best described as a geoid. A geoid is the equipotential surface of the Earth's gravity field; put simply, it has the shape of a lumpy, slightly squashed ball. Determining the precise shape of the geoid is a major concern of the science of geodesy, the study of Earth’s size, shape, and gravitational and magnetic fields. The accuracy of coordinates that specify geographic locations depends upon how the coordinate system grid is aligned with the Earth's surface, and that alignment depends on the model we use to represent the actual shape of the geoid. While geodesy is an old science, many challenging problems remain, and geodesists continue to make advances that increase our ability to locate places accurately (and that gradually make the location of the GPS in your phone more accurate).
Geoids are lumpy because gravity varies from place to place in response to local differences in terrain and variations in the density of materials in the Earth's interior. The Earth’s geoid is also a little squat, as suggested above. Sea level gravity at the poles is greater than sea level gravity at the equator, a consequence of Earth's "oblate" shape as well as the centrifugal force associated with its rotation.
Geodesists at the U.S. National Geodetic Survey (NGS Geoid 12A) describe the geoid as an "equipotential surface" because the potential energy associated with the Earth's gravitational pull is equivalent everywhere on the surface. The geoid is essentially a three-dimensional mathematical surface that fits (as closely as possible) gravity measurements taken at millions of locations around the world. As additional, and more accurate, gravity measurements become available, geodesists revise the shape of the geoid periodically. Some geoid models are solved only for limited areas; GEOID03, for instance, is calculated only for the continental U.S.
It is important to differentiate the bumpiness of a geoid from the ruggedness of Earth’s terrain, since geoids depend on gravitational measurements and are not simply representations of Earth’s topographic features. Although Earth’s topography, which consists of extreme heights like Mount Everest (29,029 ft above sea level) and incredible depths like the Mariana Trench (36,069 ft below sea level), the Earth’s average terrain is relatively smooth. Astronomer Neil de Grasse Tyson (2009) points out:
Earth, as a cosmic object is remarkably smooth; if you had a giant finger and rubbed it across Earth's surface (oceans and all), Earth would feel as smooth as a cue ball. Expensive globes that portray raised portions of Earth’s landmasses to indicate mountain ranges depict a grossly exaggerated reality. (p. 39)
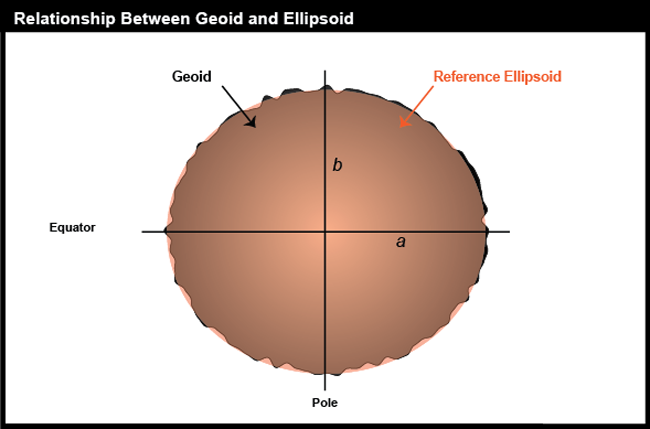
2.4.1 Ellipsoid
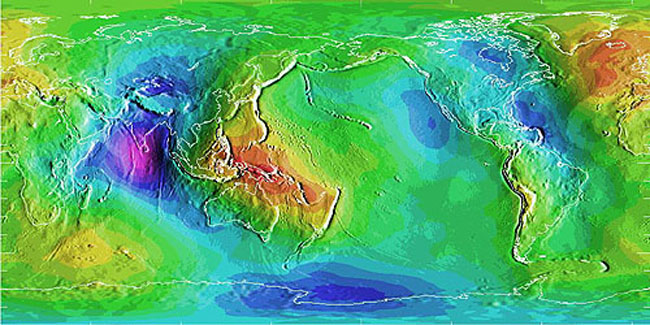
An ellipsoid is a three-dimensional geometric figure that resembles a sphere, but whose equatorial axis (a in the Figure 2.23 above) is slightly longer than its polar axis (b). Ellipsoids are commonly used as surrogates for geoids to simplify the mathematics involved in relating a coordinate system grid with a model of the Earth's shape. Ellipsoids are good, but not perfect, approximations of geoids; they more closely model the actual shape of the Earth than a simple sphere. One implication of different models of the Earth is that they represent elevation of places as different. Surveyors and engineers measure elevations at construction sites and elsewhere. Elevations are expressed in relation to a vertical datum, a reference surface such as mean sea level. Different geoids and different ellipsoids define the vertical datum differently. The map below shows differences in elevation between the GEOID96 geoid model and the WGS84 ellipsoid. The surface of GEOID96 represents the surface as being 75 meters higher than does the WGS84 ellipsoid over New Guinea (where the map is colored red). In the Indian Ocean (where the map is colored purple), the surface of GEOID96 represents the surface as about 104 meters below the ellipsoid surface.
Many ellipsoids are in use around the world. Local ellipsoids minimize differences between the geoid and the ellipsoid for individual countries or continents. The Clarke 1866 ellipsoid, for example, minimizes deviations in North America.
Once we have identified a preferable shape with which to represent the Earth (the specific ellipsoid), the next consideration that we must make is the coordinate system to provide a means to define positions of locations on that sphere (spherical coordinate system).
2.4.2 Horizontal Datums
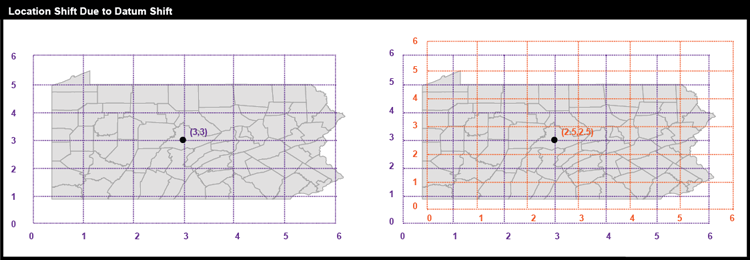
Horizontal datum is an elusive concept for many GIS practitioners. However, it is relatively easy to understand if we start with the concept that the datum defines the position of a coordinate system in relation to the places being located. Before considering horizontal datums in the context of geographic (spherical) coordinates, consider the simple example below that uses plane coordinates. In this example, the “datum” is a simple Cartesian grid. The figure shows what would happen if the horizontal datum of any plane coordinate system had a different origin from which all coordinates were determined (e.g., if the false origin of any SPCS zone was a slightly different place.
Starting from the above model, it is relatively easy to visualize a horizontal datum in the context of unprojected geographic coordinates in relation to a reference ellipsoid. Simply drape the latitude and longitude grid over the ellipsoid and shift it to align the coordinates with the ellipsoid appropriately, and there is your horizontal datum. It is harder to think about datum in the context of a projected coordinate grid like UTM and SPC, however. Think of it this way: First drape the latitude and longitude grid on an ellipsoid. Then project that grid to a 2-D plane surface. Finally, superimpose a rectangular grid of eastings and northings over the projection, using control points to geo-register the grids. There you have it--a projected coordinate grid based upon a horizontal datum. It would appear just like the example above; the difference is how we figure out the alignment between the grid and the world.
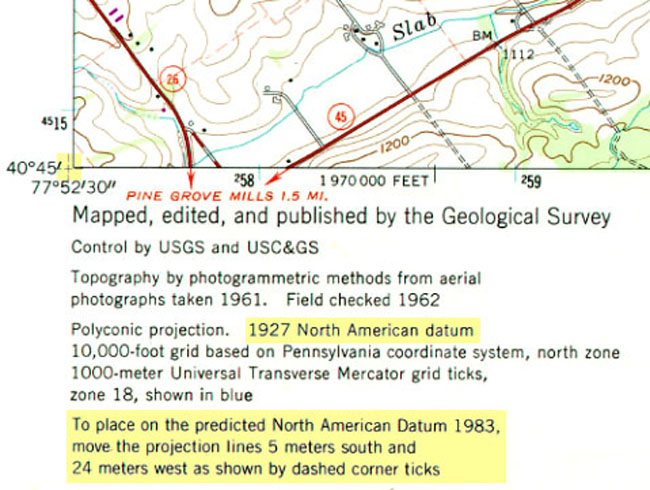
Around the world, geodesists define different horizontal datums that are appropriate (accurate) for different places. Datums are periodically updated as technology allows for increases in accuracy, but changes are infrequent since every time a change is made, there are serious implications (in cost and time) to update the position information for every place that the datum applies to. In the U.S. the two most frequently encountered horizontal datums are the North American Datum of 1927 (NAD 27) and the North American Datum of 1983 (NAD 83). The advent of the Global Positioning System (GPS) necessitated an update of NAD 27 to NAD 83 that included (a) adoption of a geocentric ellipsoid, GRS 80, in place of the Clarke 1866 ellipsoid; and (b) correction of many distortions that had accumulated in the older datum. Bearing in mind that the realization of a datum is a network of fixed control point locations that have been specified in relation to the same reference surface, the 1983 adjustment of the North American Datum caused the coordinate values of every control point managed by the National Geodetic Survey (NGS) to change. Obviously, the points themselves did not shift because of the datum transformation (although they did move a centimeter or more a year due to plate tectonics). Rather, the coordinate system grids based upon the datum shifted in relation to the new ellipsoid (just like the shift in plane coordinates illustrated above), and because local distortions were adjusted at the same time, the magnitude of grid shift varies from place to place. The illustration below compares the magnitude of the grid shifts associated with the NAD 83 adjustment at one location.
Given the irregularity of the shift (much more complex than the simple translation of the plane coordinate system shown in Figure 25), NGS could not suggest a simple transformation algorithm that surveyors and mappers could use to adjust local data based upon the older datum. Instead, NGS created a software program called NADCON (Dewhurst 1990, Mulcare 2004) that calculates adjusted coordinates from user-specified input coordinates by interpolation from a pair of 15° correction grids generated by NGS from hundreds of thousands of previously adjusted control points. The U.S. National Geodetic Survey (NGS Geoid Home) maintains a database of the coordinate specifications of these control points, including historical locations as well as adjustments that are more recent.
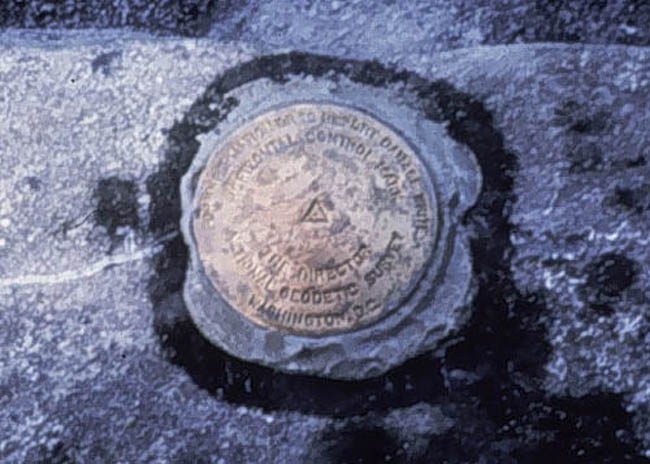
Geoids, ellipsoids, and even coordinate systems are all abstractions. The fact that a "horizontal datum" refers to a relationship between an ellipsoid and a coordinate system, two abstractions, may explain why the concept is so frequently misunderstood. Datums do have physical manifestations: approximately two million horizontal and vertical control points that have been established in the U.S. Although control point markers are fixed, the coordinates that specify their locations are liable to change. In the U.S., high-order horizontal control point locations are marked with permanent metal "monuments" like the one shown above in Figure 27. The physical manifestation of the datum is a network of control point measurements that are marked in the real world with these monuments (National Geodetic Survey, 2004).
Practice Quiz
Registered Penn State students should return now to the Chapter 2 folder in Canvas to take a self-assessment quiz about the The Nearly Spherical Earth.
You may take practice quizzes as many times as you wish. They are not scored and do not affect your grade in any way.