
Irrigation Efficiency
The amount of water used for irrigation varies depending on the climate and on the crop being grown, and it also depends on the irrigation technique used. Just like in your garden or home landscaping there are more or less efficient sprinklers. In many parts of the world flood or surface, irrigation is still used where water flows across a field and soaks into the soil.
Surface or flood irrigation is the least efficient manner of irrigation. When a field is flooded, more water than is needed by the plant is applied to the field and water evaporates, seeps into the ground, and percolates down to the groundwater, where it can be out of reach of the plant's roots. Another problem with flood irrigation is that the water is not always applied evenly to all plants. Some plants might get too much water, and others get too little. On the other hand, flood irrigation tends to use the least energy of any irrigation system.
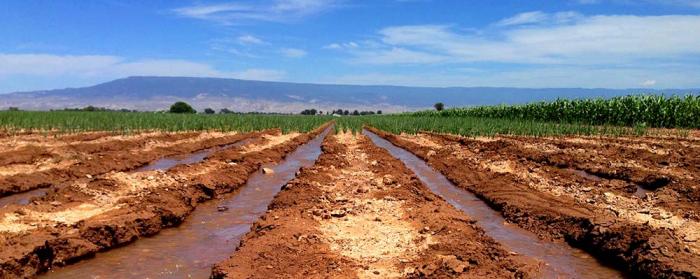
Furrow irrigation (Figure 4.1.8) is another type of surface irrigation in which water is directed through gated pipe or siphon tubes into furrows between rows of plants. When using furrow irrigation, water is lost to surface runoff, groundwater, and evaporation, and it can be challenging to get water evenly to an entire field.
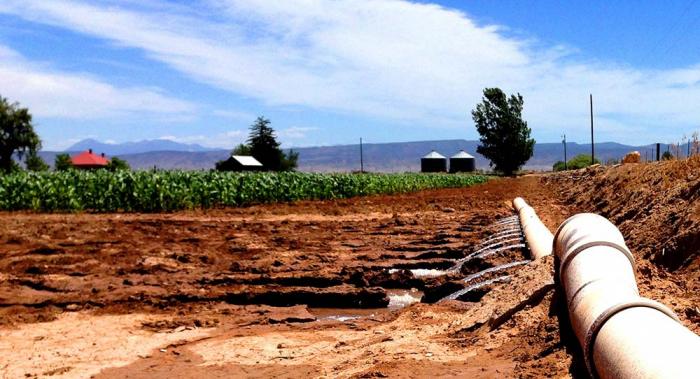
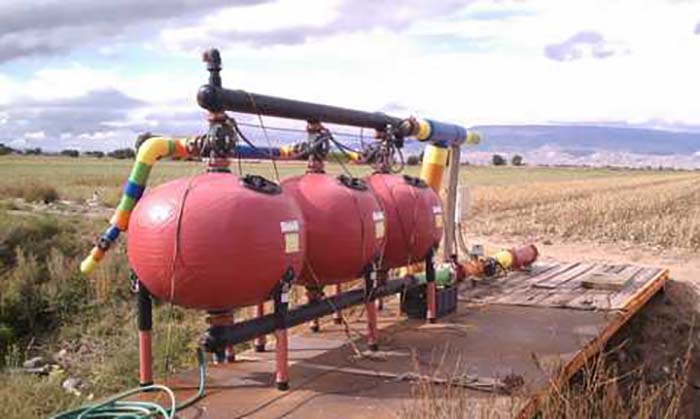
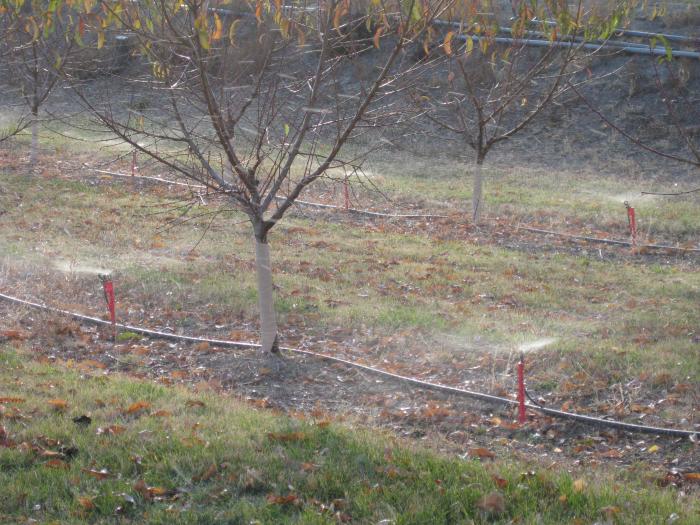
More efficient methods of irrigation include drip irrigation (Figure 4.1.9) sprinklers (such as center pivots, Figure 4.1.10), and micro-spray (Figure 4.1.11) irrigation. All of these methods, while more efficient, also require significant investments in equipment, pipes, infrastructure (e.g., pumps Figure 4.1.9) and energy. In addition to the high cost, some soil types, irrigation networks, field sizes, and crops pose greater challenges to the implementation of more efficient methods of irrigation. For example, in the Grand Valley of western Colorado, the irrigation network is entirely gravity-fed, meaning that farmers can easily flood and furrow irrigate without the use of pumps. In addition, the fields are small and the soils are very clayey, all of which make using center pivots for row crops particularly challenging and expensive. But, in the same valley, the peach orchards have successfully used micro-spray and drip systems. A major advantage of more efficient irrigation in addition to reduced water consumption is that crop yields are often higher because the water can be applied more directly to the plant when water is needed.


Activate Your Learning
Table 4.1.1 presents data on the top 15 irrigated states in the United States. You can see how many acres of land are irrigated in each state, and how much water is used for irrigation of both surface water and groundwater. Consider the relationship between the amount of irrigated land in a state, the type of irrigation used and the amount of water used.
An acre-foot is a unit of measure for large volumes of water and is the volume of water required to cover one acre of land to a depth of one foot (325,851 gallons). Imagine a football field, including the end zones, one foot deep in water.
| State | Irrigated Land (in thousand acres) by type of irrigation |
Surface Water Withdrawals | Groundwater Withdrawals | Total Irrigation Withdrawals | ||||||
|---|---|---|---|---|---|---|---|---|---|---|
| - | Sprinkler | Micro-irrigation | Surface | Total | Thousand acre-feet per year | % of irrigation water from surface water | Thousand acre-feet per year | % of irrigation water from groundwater | Thousand acre-feet per year | Percent of total water withdrawals used for irrigation |
| California | 1790 | 2890 | 5670 | 10400 | 16100 | 62% | 9740 | 38% | 25840 | 61% |
| Idaho | 2420 | 4.57 | 1180 | 3600 | 11500 | 73% | 4280 | 27% | 15780 | 82% |
| Colorado | 1410 | 0.2 | 1930 | 3340 | 9440 | 87% | 1450 | 13% | 10890 | 88% |
| Arkansas | 518 | 0 | 4150 | 4670 | 1500 | 15% | 8270 | 85% | 9770 | 77% |
| Montana | 753 | 0.64 | 886 | 1640 | 7880 | 98% | 142 | 2% | 8022 | 94% |
| Texas | 3770 | 244 | 1910 | 5920 | 1940 | 25% | 5710 | 75% | 7650 | 27% |
| Nebraska | 6370 | 0.57 | 2360 | 8730 | 1520 | 24% | 4820 | 76% | 6340 | 70% |
| Oregon | 1210 | 97 | 594 | 1900 | 3750 | 64% | 2140 | 36% | 5890 | 78% |
| Arizona | 195 | 28.1 | 770 | 993 | 3220 | 63% | 1900 | 37% | 5120 | 75% |
| Wyoming | 184 | 4.12 | 892 | 1080 | 4410 | 90% | 490 | 10% | 4900 | 93% |
| Utah | 625 | 1.45 | 710 | 1340 | 3060 | 85% | 554 | 15% | 3614 | 72% |
| Washington | 1270 | 86.1 | 221 | 1580 | 2630 | 75% | 894 | 25% | 3524 | 63% |
| Kansas | 2840 | 18.1 | 217 | 3080 | 179 | 5% | 3230 | 95% | 3409 | 76% |
| Florida | 548 | 712 | 731 | 1990 | 1500 | 46% | 1770 | 54% | 3270 | 20% |
| New Mexico | 461 | 19.6 | 397 | 878 | 1640 | 54% | 1390 | 46% | 3030 | 86% |