As mentioned on the Lesson 5 overview page, the course text, Holden 2014, does not cover the Köppen Climate System topic, so use the following material and the listed websites to learn about the Köppen Climate System.
Köppen Climate System
- PhysicalGeography.net - Climate Classification and Climatic Regions of the World
- Köppen Climate Classification System | National Geographic Society
or
Registered students can access the KoppenClimateClassification(elmhurst).pdf file under Lesson 5 in Canvas.
Hadley cells and the Inter-tropical Convergence Zone (ITCZ)
Weather / Climate
Weather is the condition of the atmosphere at any given place and time, and the variability of this weather over time is climate. Climates greatly influence ecosystems, and these ecosystems are grouped together to form biomes. Each biome has associated plant, soil, and animal communities. The various climate components include insolation, temperature, air pressure, air masses, and precipitation. Temperature is mainly controlled by latitude, altitude/elevation, and cloud cover.
Climatology is the study of climates and it analyzes weather patterns over time and space. There are six basic climate categories:
- Tropical = equatorial and tropical latitudes
- Desert = permanent moisture deficits
- Mesothermal = midlatitudes and mild winter
- Microthermal = mid- and high latitude, cold winter
- Polar = high latitudes and polar regions
- Highland = lower temperatures compared to lowlands at same latitude
Köppen
The Köppen system uses capital letters (A,B,C,D,E,H) to designate climatic categories from the equator to the poles. Categories A, C-H are based off of thermal characteristics, and B is based off of moisture as well. Within each climate classification lowercase letters signify temperature and moisture conditions. See table 5.1 below.
- A = Tropical
- B = Desert (arid, dry)
- C = Mesothermal
- D = Microthermal
- E = Polar
- H = Highland
The link below shows the different Köppen climate types around the globe. You can select a region of interest to learn more about the climate type that you chose.
Required Viewing
An illustrated Microsoft PowerPoint presentation (GEOG 431 Lesson 5 PPT) is provided to introduce you to the places and appearance of the major climate regions (Brooks 2014).
Registered students can access the GEOG 431 Lesson 5 PPT file in Canvas.
Köppen uses average monthly temperatures, average monthly precipitation, and total annual precipitation to devise its spatial categories and boundaries. These boundaries serve as transition zones of gradual change between two climate systems. Drawbacks of the modified Köppen system include that it does not consider wind, temperature extremes, precipitation intensity, quantity of sunshine, cloud cover, or net radiation.
Climographs
A climograph shows the monthly temperatures and precipitation over a typical year, subdivided into months. Also, it can provide location coordinates, average annual temperature, total annual precipitation, elevation, the local population, annual temperature range, annual hours of sunshine, and a location map. For examples of temperature and precipitation graphs for the various climate categories, visit the site below. The temperature and precipitation graphs can be found below the description of the five major climatic types. Use these graphs, or similar ones, for addressing Assignment 5.1.c.
The differential heating patterns
The differential heating patterns on Earth’s surface cause winds, which circulate heat and moisture. These winds do not blow exactly in a north-south direction; instead they appear to be deflected toward the east or west by the Coriolis Force. This effect results in the tendency of moving objects to veer to the right in the Northern Hemisphere and to the left in the Southern Hemisphere. The winds approaching the equator from the Horse Latitudes appear to be deflected west and are called northeast or southeast trade winds.
These surface winds also impact and influence the major ocean currents. Ocean currents move in great circular gyres—clockwise in the Northern Hemisphere and counterclockwise in the Southern Hemisphere. Warm currents flow from the tropics along eastern continental margins; as they reach high latitudes, they are cooled, producing cold currents that flow down the western margins. Warmer currents can absorb increasing amounts of evaporated water. By later cooling and condensing this water clouds are formed. The following links below provide good visual illustration of different wind circulation patterns.
Example of one of many global oscillation patterns that influence weather and climate
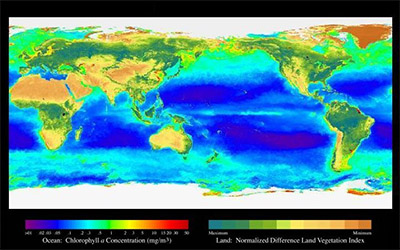
Climate studies show that precipitation fluctuates on a five to seven-year cycle. Fluctuations appear to be triggered by an event in the vast tropical Pacific Ocean—El Niño Southern Oscillation, or ENSO. As the westerly winds pass over warm water, they pick up moisture and transport it to the adjacent continents, causing heavy precipitation in the winter when the land is colder than the offshore waters. This phenomenon is known as El Niño. ENSO events are also characterized by reduced coastal upwelling, which results in dramatic reductions in nutrients and ultimately affects the entire food chain of oceanic communities. The link below provides additional details on El Niño as well as graphs illustrating the changes in sea surface temperature.
| Type | Type Name |
Sub Type | Sub Type Name |
Characteristics |
|---|---|---|---|---|
| A | Tropical Humid | Af | Tropical wet | No dry season |
| — | — | Am | Tropical monsoonal | Short dry season; heavy monsoonal rains in other months |
| — | — | Aw | Tropical savanna | Winter dry season |
| B | Dry | BWh | Subtropical desert | Low-latitude desert |
| — | — | BSh | Subtropical steppe | Low-latitude dry |
| — | — | BWk | Mid-latitude desert | Mid-latitude desert |
| — | — | BSk | Mid-latitude steppe | Mid-latitude dry |
| C | Mild Mid-Latitude | Csa | Mediterranean | Mild with dry, hot summer |
| — | — | Csb | Mediterranean | Mild with dry, warm summer |
| — | — | Cfa | Humid subtropical | Mild with no dry season, hot summer |
| — | — | Cwa | Humid subtropical | Mild with dry winter, hot summer |
| — | — | Cfb | Marine west coast | Mild with no dry season, warm summer |
| — | — | Cfc | Marine west coast | Mild with no dry season, cool summer |
| D | Severe Mid-Latitude | Dfa | Humid continental | Humid with severe winter, no dry season, hot summer |
| — | — | Dfb | Humid continental | Humid with severe winter, no dry season, warm summer |
| — | — | Dwa | Humid continental | Humid with severe, dry winter, hot summer |
| — | — | Dwb | Humid continental | Humid with severe, dry winter, warm summer |
| — | — | Dfc | Subarctic | Severe winter, no dry season, cool summer |
| — | — | Dfd | Subarctic | Severe, very cold winter, no dry season, cool summer |
| — | — | Dwc | Subarctic | Severe, dry winter, cool summer |
| — | — | Dwd | Subarctic | Severe, very cold and dry winter, cool summer |
| E | Polar | ET | Tundra | Polar tundra, no true summer |
| — | — | EF | Ice Cap | Perennial ice |
| H | Highland | — | — | — |