
In 1976, Amory Lovins wrote about 'hard' and 'soft' energy paths (which you'll be reading all about in this week's assigned reading) and how the path the nation chooses would dictate the energy future that would follow. Now, more than three decades later, we can recall the energy futures Lovins predicted based on policy choices in the 1970s and understand the implications of energy policy of that time.
Characteristics of hard energy paths:
- centralized high technologies
- increasing supplies of energy (especially electricity)
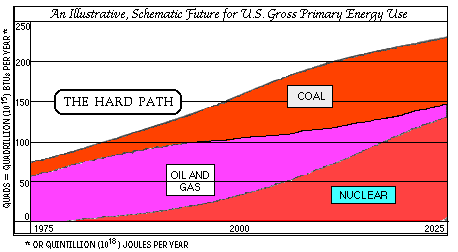
This graph depicts Amory Lovins' description of a hard energy path, reliant on centralized fossil fuels. While nuclear fuel is projected to play a much bigger role post-2000, the reliance on coal and natural gas still leads us down a heavily carbonized path. What this graph wasn't able to predict at the time of its conception was the boom in natural gas production, both domestically and globally, with unconventional plays in shale formations creating a surge in its market share, snuffing out coal to a large extent.
The Negawatt Revolution 1989
The Negawatt Revolution 1989
Credit: Amory Lovins
Characteristics of soft energy paths:
- emphasis on energy efficiency
- development of renewable energy sources - matching in scale and quality to the end use need
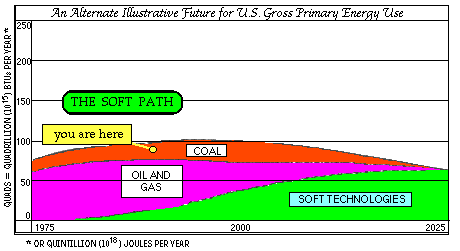
This graph depicts Amory Lovins' concept of a soft energy path, emphasizing energy efficiency and increased use of renewable sources. This illustration of the soft energy path not only demonstrates a downward trend over time in overall emissions, but more importantly, a relatively rapid decline in reliance on traditional centralized fossil fuels like oil, gas, and coal, in favor of what Lovins described as soft technologies, including decentralized renewable energy like residential rooftop solar.
The Negawatt Revolution 1989
The Negawatt Revolution 1989
Credit: Amory Lovins