So far in this lesson, your scripts have only read and edited vector datasets. This work largely consists of cycling through tables of records and reading and writing values to certain fields. Raster data is very different, and consists only of a series of cells, each with its own value. So, how do you access and manipulate raster data using Python?
It's unlikely that you will ever need to cycle through a raster cell by cell on your own using Python, and that technique is outside the scope of this course. Instead, you'll most often use predefined tools to read and manipulate rasters. These tools have been designed to operate on various types of rasters and perform the cell-by-cell computations so that you don't have to.
In ArcGIS, most of the tools you'll use when working with rasters are in either the Data Management > Raster toolset or the Spatial Analyst toolbox. These tools can reproject, clip, mosaic, and reclassify rasters. They can calculate slope, hillshade, and aspect rasters from DEMs.
The Spatial Analyst toolbox also contains tools for performing map algebra on rasters. Multiplying or adding many rasters together using map algebra is important for GIS site selection scenarios. For example, you may be trying to find the best location for a new restaurant and you have seven criteria that must be met. If you can create a boolean raster (containing 1 for suitable, 0 for unsuitable) for each criterion, you can use map algebra to multiply the rasters and determine which cells receive a score of 1, meeting all the criteria. (Alternatively, you could add the rasters together and determine which areas received a value of 7.) Other courses in the Penn State GIS certificate program walk through these types of scenarios in more detail.
The tricky part of map algebra is constructing the expression, which is a string stating what the map algebra operation is supposed to do. ArcGIS Pro contains interfaces for constructing an expression for one-time runs of the tool. But what if you want to run the analysis several times, or with different datasets? It's challenging even in ModelBuilder to build a flexible expression into the map algebra tools. With Python, you can manipulate the expression as much as you need.
Example
Examine the following example, which takes in a minimum and maximum elevation value as parameters, then does some map algebra with those values. The expression isolates areas where the elevation is greater than the minimum parameter and less than the maximum parameter. Cells that satisfy the expression are given a value of 1 by the software, and cells that do not satisfy the expression are given a value of 0.
But what if you don't want those 0 values cluttering your raster? This script gets rid of the 0's by running the Reclassify tool with a real simple remap table stating that input raster values of 1 should remain 1. Because 0 is left out of the remap table, it gets reclassified as NoData:
# This script takes a DEM, a minimum elevation,
#  and a maximum elevation. It outputs a new
#  raster showing only areas that fall between
#  the min and the max

import arcpy
from arcpy.sa import *
arcpy.env.overwriteOutput = True
arcpy.env.workspace = "C:/Data/Elevation"

# Get parameters of min and max elevations
inMin = arcpy.GetParameterAsText(0)
inMax = arcpy.GetParameterAsText(1)

arcpy.CheckOutExtension("Spatial")

# Perform the map algebra and make a temporary raster
inDem = Raster("foxlake")
tempRaster = (inDem > int(inMin)) & (inDem < int(inMax))

# Set up remap table and call Reclassify, leaving all values not 1 as NODATA
remap = RemapValue([[1,1]])
remappedRaster = Reclassify(tempRaster, "Value", remap, "NODATA")

# Save the reclassified raster to disk
remappedRaster.save("foxlake_recl")

arcpy.CheckInExtension("Spatial")
Read the example above carefully, as many times as necessary, for you to understand what is occurring in each line. Notice the following things:
- Notice the expression contains > and < signs, as well as the & operator. You have to enclose each side of the expression in parentheses to avoid confusing the & operator.
- Because you used arcpy.GetParameterAsText() to get the input parameters, you have to cast the input to an integer before you can do map algebra with it. If we just used inMin, the software would see "3000," for example, and would try to interpret that as a string. To do the numerical comparison, we have to use int(inMin). Then the software sees the number 3000 instead of the string "3000."
- Map algebra can perform many types of math and operations on rasters, not limited to "greater than" or "less than." For example, you can use map algebra to find the cosine of a raster.
- If you're working at a site where a license manager restricts the Spatial Analyst extension to a certain number of users, you must check out the extension in your script, then check it back in. Notice the calls to arcpy.CheckOutExtension() and arcpy.CheckInExtension(). You can pass in other extensions besides "Spatial" as arguments to these methods.
- Notice that the script doesn't call these Spatial Analyst functions using arcpy. Instead, it imports functions from the Spatial Analyst module (from arcpy.sa import *) and calls the functions directly. For example, we don't see arcpy.Reclassify(); instead, we just call Reclassify() directly. This can be confusing for beginners (and old pros) so be sure to check the Esri samples closely for each tool you plan to run. Follow the syntax in the samples and you'll usually be safe.
- See the Remap classes topic in the help to understand how the remap table in this example was created. Whenever you run Reclassify, you have to create a remap table stating how the old values should be reclassified to new values. This example has about the simplest remap table possible, but if you want a more complex remap table, you'll need to study the documentation.
Rasters and file extensions
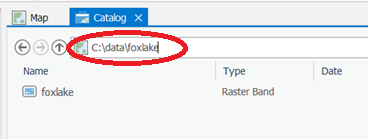
The above example script doesn't use any file extensions for the rasters. This is because the rasters use the Esri GRID format, which doesn't use extensions. If you have rasters in another format, such as .jpg, you will need to add the correct file extension. If you're unsure of the syntax to use when providing a raster file name, double click the raster in Catalog View and note its Location in the pop-out box.
If you look at rasters such as an Esri GRID in Windows Explorer, you may see that they actually consist of several supporting files with different extensions, sometimes even contained in a series of folders. Don't try to guess one of the files to reference; instead, use Catalog View to get the path to the raster. When you use this path, the supporting files and folders will work together automatically.
Readings
Zandbergen chapter 10 covers a lot of additional functions you can perform with rasters and has some good code examples. You don't have to understand everything in this chapter, but it might give you some good ideas for your final project.