Background Information
Water Levels and Wetland Vegetation
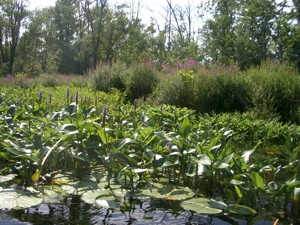
Last week, we talked about why wetlands are important, threats to wetlands such as human activities and invasive species, and wetland protection and restoration programs. This week, we will discuss how wetlands function. Hydraulic conditions are very important in wetland ecosystems because they influence their physical and chemical properties. Water depth is particularly important because it influences which types of vegetation are present, their abundance, and where they grow. Certain types of vegetation provide much better habitat than others. For example, aquatic and emergent vegetation provide cover that fish need to hide from predators and raise their young. Plants can be grouped into a few main categories based on the depth of water they prefer (listed from deepest water to dry land): submersed aquatic, floating aquatic, emergent, and terrestrial (e.g., shrubs and trees). These groups should look familiar to you (Hint: look in the Veg_Group shapefiles we created last week).
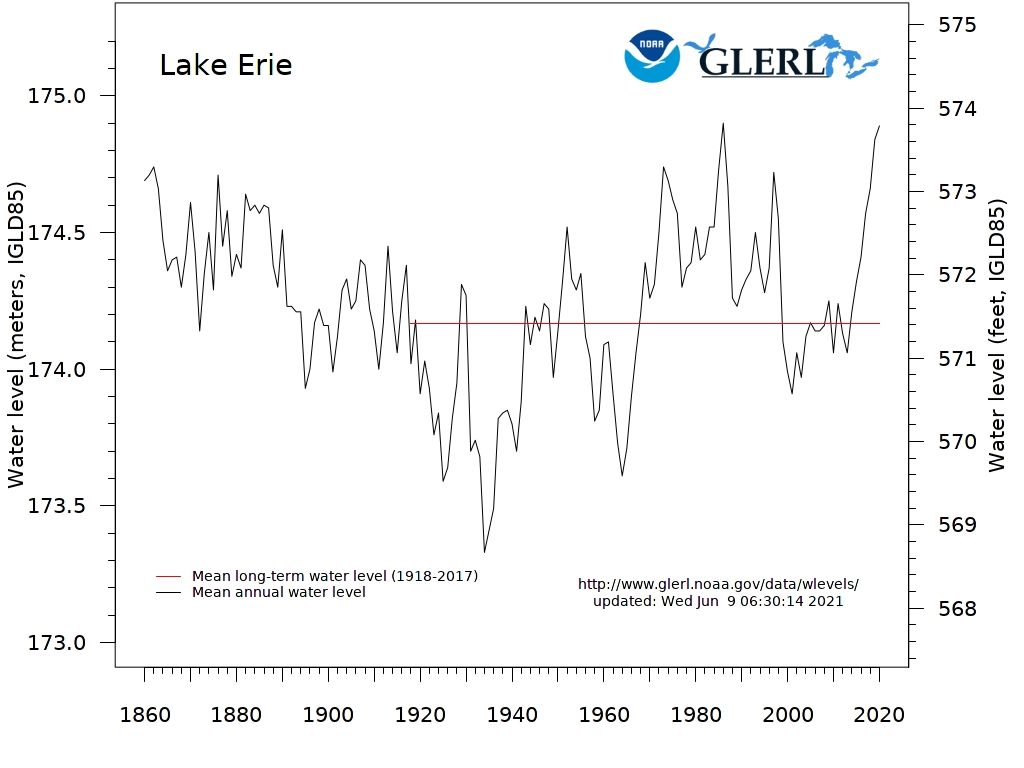
Wetlands are very dynamic; the physical and chemical properties of a given wetland can vary depending on current hydraulic conditions within a watershed. Some wetlands fluctuate more than others, especially those that are hydraulically connected to larger bodies of water such as drowned river-mouth wetlands along the Great Lakes or tidal salt marshes along the nation’s coasts. In these types of wetlands, the water elevation of the wetland rises and falls in response to water elevation changes in the main body of water. Water levels can fluctuate at different time scales, such as centuries, decades, annually, seasonally, daily, and even hourly. For example, the graph below shows the water levels of Lake Erie between 1850 and the present. You can see that water levels can fluctuate by more than 3 ft in a period of one or two years.
As water levels rise and fall, the water depths at any given location within a wetland will vary based on its bathymetry. For example, in an area with gentle slopes, an increase in water elevation will be spread over a larger area, so the water depth will not increase as much as in an area with steep slopes. This constant change in water depths naturally regulates plant communities. During periods of lower water levels, species that require deep water don’t survive. At the same time, underlying soils are exposed, allowing seeds from a variety of plants to germinate and mature. The opposite is also true. During periods of high water, species that require shallow water are drowned and eliminated. When the hydraulic properties of a wetland are modified, the natural cycle of vegetation regulation and regeneration is disturbed. Without low water levels to control their growth, some species are able to thrive season after season while others are never given the opportunity to grow.
Study Site Background Information
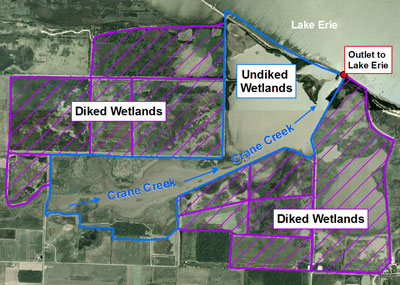
The drowned-river mouth wetlands within our study are part of the Ottawa National Wildlife Refuge, which was created in 1961 to preserve vital habitat for migratory birds. The refuge contains approximately 4,500 acres of wetlands, the majority of which have been diked to control their water levels for over 60 years. Refuge managers use the dikes to maintain a series of ponds with different water depths at different times of the year. This allows them to create habitat for a variety of species, though management techniques favor migratory birds. By mimicking the natural rise and fall of water levels within the diked wetlands, emergent vegetation, which is habitat for many species, is able to thrive. Without the dikes, much of the habitat would not exist. However, the dikes hydraulically disconnect the pools from Crane Creek and Lake Erie, so that only a subset of wetland species can utilize the habitat. For example, fish, clams, and other small organisms cannot travel over the dikes.
Only a small portion of the wetlands in the refuge are not diked (e.g., wetlands within the study site); however, they are severely degraded. These wetlands have the potential to provide critical habitat since they are still connected to Lake Erie. The frequent high water levels of Lake Erie since the 1970s have contributed to the lack of natural regeneration of emergent vegetation in the undiked wetlands. Without human intervention, it is unlikely that water levels will lower enough to re-establish the vegetation that fish use for spawning and protection of their young. Wetland managers are also struggling to control the spread of several invasive plants, that threaten the native flora and fauna, including giant reed-grass (Phragmites australis), reed-canary grass (Phalaris arundinacea), narrow-leaved cattail (Typha augustifolia), purple loosestrife (Lythrum salicaria), and flowering rush (Butomus umbellatus).
Using GIS for Wetland Restoration Projects
GIS is a powerful tool to help wetland managers. We know that wetlands fluctuate over time in response to changes in local and regional hydrological conditions. Historical aerial photos can help us understand these changes over time. For example, they can show how vegetation in a particular wetland has responded in the past to changes in water levels. Digitizing the vegetation into a GIS database is much more useful than just looking at the images. Once the data are in a GIS format, wetland managers can easily calculate statistics, identify trends, and create models that allow them to predict the types and abundance of vegetation they can expect at different water levels. For example, they could model future vegetation changes in response to water level fluctuations caused by climate change. They can also use the data to create baseline vegetation maps to evaluate restoration efforts, such as attempts to regenerate emergent vegetation, map the spread of invasive species over time, and evaluate control methods.
Last week, we used several publicly available datasets to familiarize ourselves with our study area wetlands. We also created several new datasets related to wetland vegetation, including species, vegetation groups, and invasive species. In Lesson 4, we are going to use this data to explore a real-world example of how GIS can be used to assist wetland managers in restoration efforts. We will also explore several methods in ArcGIS to interpret and compare multiple time-series datasets.