Background Information
The Role of Forests in Climate Change
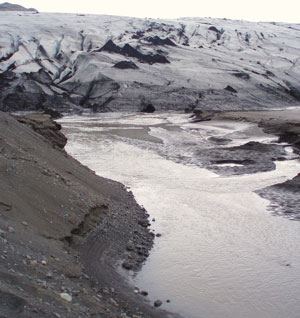
Calculating carbon sequestration and associated carbon credits for forests is an initiative related to climate change. Climate change, also known as global warming, is caused by increased levels of greenhouse gases trapped in Earth’s atmosphere. Some of the expected effects of global warming include melting glaciers, sea-level rise, changes in water resources, changes in food production, loss of biodiversity, increases in extreme weather, and threats to human health.
Forests play an important role in climate change due to the fact that trees naturally absorb and release carbon dioxide during their life cycle. During photosynthesis, they remove carbon dioxide from the air and store it as organic matter in their trunks, branches, foliage, roots, and soils. This process is known as carbon sequestration. When trees decay or burn, they release their stored carbon back into the atmosphere. The amount of carbon a particular tree absorbs or releases throughout its lifecycle is negligible. However, due to their global abundance, the cumulative effect is very large.
The Intergovernmental Panel on Climate Change (IPCC), winner of the 2007 Nobel Peace Prize, is the United Nations body for assessing the science related to climate change and, therefore, often considered the world’s leading authority on climate change. One of their recommendations is that we need to mitigate the future impacts of climate change by reducing current and future emissions. One way to reduce emissions is to reduce the number of forests that are clear-cut or degraded since these activities account for about 15% of global greenhouse gas emissions. There are simply some existing natural environments that we cannot afford to lose due to their irrecoverable carbon reserves. And, preserving existing forests is considered a much better alternative to reforestation or afforestation, as it takes decades for a new tree to grow and absorb the amount of carbon that is released when a mature tree is lost.
There are several initiatives to encourage the preservation of existing forests on a global scale. Reduced Emissions from Deforestation and Forest Degradation (REDD+) is a framework by the UNFCCC (United Nations Framework Convention on Climate Change) Conference that guides activities that will provide financial compensation to landowners for maintaining and protecting forests. To receive compensation under the REDD+ initiative, landowners need to be able to assess the amount of carbon that is stored in the trees on their property. Many of the methods to do this require a forest inventory in which tree species, height, and diameter at breast height (DBH) are measured. This information is used to estimate the volume of organic matter for each tree, which is then translated into results-based financing, whose value fluctuates depending on the current market trading value of carbon.
Field Data Collection & Representative Samples
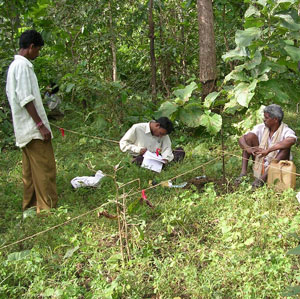
While it would be more accurate to measure every tree in a forest during field inventories, limitations of time and money typically make this unfeasible. This is especially true for large or hard-to-access areas (e.g., mangrove forests, swamp forests, forests with steep topography). Therefore, a common practice has been to collect a representative sample and then interpolate the values for the entire study area or use remotely sensed data. In this activity, we will concentrate our efforts on a representative sample. Forests can be inventoried by demarcating a number of sampling locations known as plots. Trees are only measured if they fall within the plot boundaries. The number and location of plots required for a given area depend on the size of the forest and the amount of variation within the study area. Large forests or forests with a lot of variation in tree cover will require more plots than small forests or forests with uniform tree cover.
GIS can be very helpful when trying to decide on the number and location of sample plots. For example, you can overlay your site boundary with current and historical aerial photos to look for variations in forest cover. You can also incorporate other datasets such as Digital Elevation Models (DEMs), hydrology, parcel boundaries, and roads. These datasets will help you identify possible hazards in the field such as fences, large rivers, steep terrain, etc. They can also help you estimate the age of the forest, depending on how old the forest is and how far back you can find aerial photos.
Most of these concepts are not unique to forest inventories. It is actually quite common in the environmental field to use representative samples to understand larger areas. For example, environmental consultants typically install monitoring wells to understand how groundwater and soil conditions vary across a site. By measuring water levels in the monitoring wells, they are able to calculate the direction and speed of groundwater flow for the whole site. They also collect groundwater and soil samples at these locations to determine if pollution levels exceed legal limits. Since the locations of the samples are known, it is possible to plot them on a map and use their location to predict values between monitoring wells.
Interpolating Sample Data with Spatial Analyst
After data is collected in the field, it is common to enter the data into an electronic format such as an Excel table, CSV file, or a simple database. As long as the field measurements are in a digital format, it is possible to view them in ArcGIS. Depending on the native file type, you may need to complete some intermediate processing steps for ArcGIS Pro to recognize them. Using the "Join" and "Display XY Data" tools in ArcGIS, it is possible to create shapefiles from tabular data. You can then use your shapefiles to identify spatial patterns in your data and create maps of your results.
The interpolation tools available within the ArcGIS Spatial Analyst Extension are particularly helpful when working with representative point data. In Lesson 6, we will practice interpolating point data to estimate values for areas that were not actually sampled. We will also explore how the options and environment settings listed below affect the output grids created by Spatial Analyst tools. We will read more about these settings in the help articles listed in the required readings section.
- Cell Size: Specifies how coarse or fine the resolution of the output raster will be. Cell size is specified by the length of each cell in the output raster. Since pixels are square, the length and width will always be the same value. You can use the cell size to calculate areas of raster grids using the equation "length * width * the number of cells." A common mistake is to assume the units of cell size refer to the area instead of length. The units of cell size are the same as the units of the coordinate system stored with the data. The calculated area of a raster will vary depending on the cell size you specify.
- Extent: The overall size and location of your output rasters, defined as the coordinates of the lower-left cell and the coordinates of the upper-right cell. This setting is often confused with the mask setting.
- Mask: Specifies the portions of the output raster that will be assigned calculated values as opposed to "NoData." This setting is often confused with the extent setting. You can also use a combination of extent and mask settings to mimic the clip and union tools used for vector files.
- Output Coordinate System: The reference coordinate system for the output files. Modifying this setting is one way to project raster files.
- Work Space: The folder (pathname) where your output files will be saved. Spatial Analyst performs better if your input and output files are saved in the same directory.