Overview
Following the initial design activities of the Needs Assessment and Concept Selection, the next step is to focus on developing one or more system prototypes. Prototypes help concretize design goals gathered during the Needs Assessment and Concept Selection phases. They also give you the opportunity to elicit feedback from clients and end-users on your design direction. There are often multiple ways to interpret and concretize system features and design aspects that are gathered during Needs Assessment and Concept Selection, so prototyping can help you figure out which way works best for the intended user group.
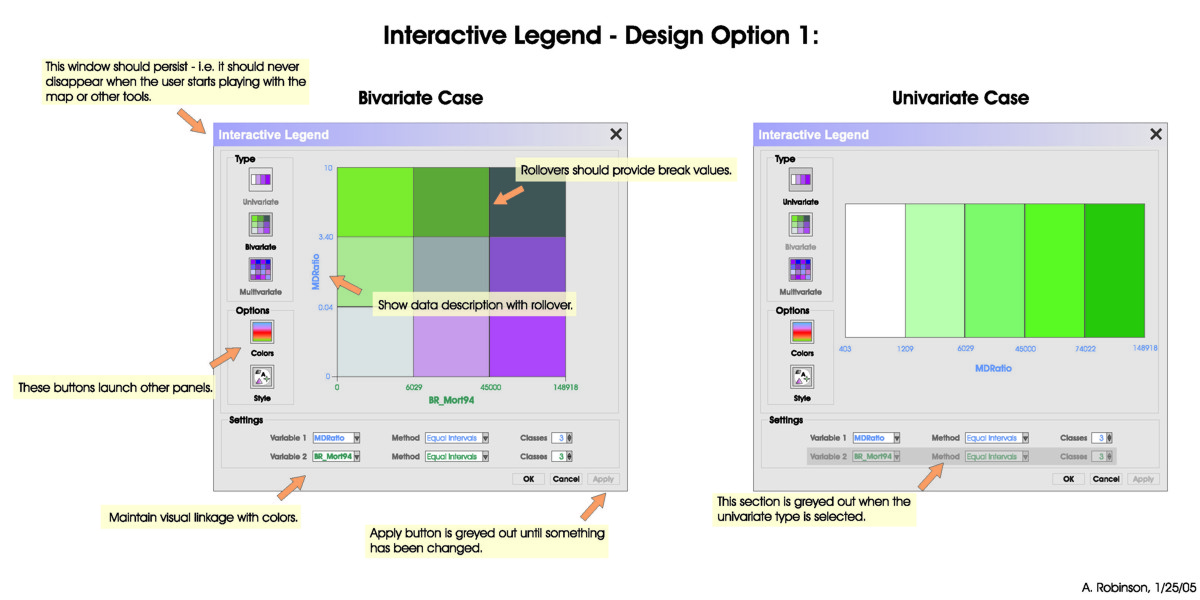
Bivariate Case
The first image is a Bivariate Case and includes an interactive legend that should persist – i.e. It should never disappear when the user starts playing with the map or other tools.
There are 3 Type buttons down the left side.
- Univariate
- Bivariate
- Multivariate
There are 2 Options buttons below the type buttons. Text next to these buttons says “These buttons launch other panels.”
- Colors
- Style
There is a settings box with dropdown menus for
- Variable 1 = MD Ratio, Method = Equal Intervals, Classes = 3 (all of these use blue text)
- Variable 2 = BR_Mort94, Method = Equal intervals, Classes = 3 (all of these use green text)
- The text next to the settings box says “Maintain visual linkage with colors”.
There are three buttons at the bottom: Ok, Cancel, and Apply. The apply button is grayed out until something has been changed.
The large image above is a 3 x 3 grid with MDRatio on the Y-axis and BR_Mort94 on the X-axis. All of the boxes of the grid are different colors (shades between blue, purple, and grey). The text pointing to MDRatio says “Show data description with rollover”. The text pointing to one of the grids says “Rollovers should provide break values”.
Univariate Case
The second image is a univariate case. The type, options, and settings buttons are the same except Variable 2 is greyed out. This section is greyed out when the univariate type is selected. Rather than the 3 x 3 grid, the image is just of the MDRatio and is 5 color blocks in a line going from white to dark green with various shades of green in between.
Image Credit: Anthony Robinson © Penn State University is licensed under CC BY-NC-SA 4.0
Objectives
At the successful completion of Lesson 4, students should be able to:
- Use Balsamiq or a similar tool to create a prototype design of their web or mobile interface that will go into their final project proposal
- Explain the process the user will take when navigating your proposed database design
- Discuss how you could envision using or incorporating VGI in the design of GISystems
Assignments
Lesson 4 is one week in length. Please refer to the syllabus or the course calendar for specific assignment instructions and due dates.
Questions?
If you have questions now or at any point during this week, please feel free to post them in the General Questions Discussion Forum. While you are there, feel free to post your own responses and comments if you are able to help out a classmate.