Getting data out of OpenStreetMap (OSM) presents more technical challenges than putting data into OSM. When you put data into OSM, you can use your choice of a number of different types of editors. You can use any tags that you want, attempting to stick to tagging conventions of course.
In contrast, when you get data out of OSM, you have to deal with the following:
- Retrieving only the tags you need
- Retrieving the data format you need
- Not overwhelming yourself or the server by requesting too much data
Complicating matters is the fact that OSM returns data in its own structure of XML, which is not immediately readable by many GIS applications. Therefore, getting data from OSM often involves converting from this XML into some other format.
There are a variety of mechanisms for downloading OSM data. The easiest ones address the challenges by providing a way to filter the tags you want, allowing you to specify the output format, and allowing you to specify a geographic bounding box for the requested data, so you don't retrieve too much.
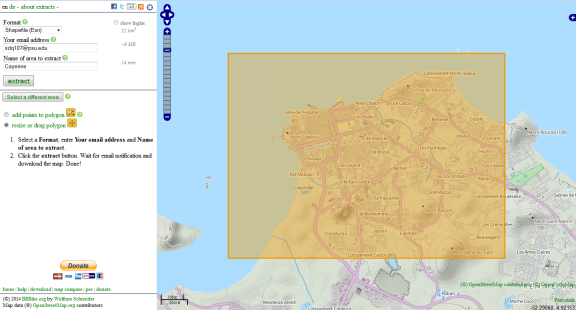
One of the most user-friendly GUI-oriented ways that I have found for retrieving OSM data is a server at BBBike.org. This little web-based tool allows you to draw a bounding box interactively and specify the output format you want. After a while, you receive an e-mail with a link to download your data.
In the walkthrough, however, we'll use the OSM download mechanism that is available in QGIS via the OSMDownloader plugin. Although this way is a little more advanced than the BBBike extract service, it is more immediate and allows greater flexibility for the amount of data and tags selected.
Downloading OSM data using QGIS
Examine the image below of Cayenne, French Guiana. You'll notice that the city has detailed building footprint polygons available. Let's suppose that we want to get a shapefile of these building footprints using QGIS.
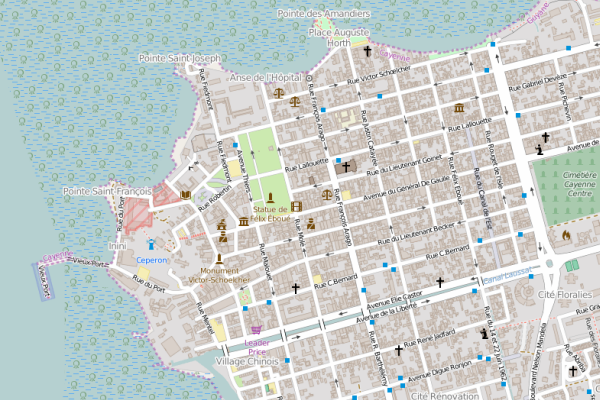
Note that we have defined our three pieces of essential information to filter the OSM data we want:
- The tags we want: any polygon with the building tag populated as anything other than building=no (a somewhat rare value but one that is occasionally used)
- The format we want: a shapefile
- The bounding box of data we want: just the city of Cayenne
While in a previous version of QGIS, downloading OSM data was integrated into the main program and available under Vector > OpenStreetMap > Download data, this functionality has been removed and now requires a plugin to be installed. On the positive side, these plugins now require much fewer steps to obtain the data. There are several plugins available that can be used for downloading OSM data. We here show you the steps using the OSMDownloader plugin. Go ahead and install this plugin from the QGIS plugin manager. You should be able to find it under "Not installed". When activated, the plugin will add a toolbar with a single button to QGIS:  When you click it, this button will become highlighted and you can then select an area in the map canvas for which you want to download the OSM data.
Now perform the following steps:
- Create a new data folder such as c:\data\Cayenne to download the data to.
- In QGIS start a new project and use EPSG:4326 for the coordinate reference system. This is just so that all coordinates displayed by QGIS will be WGS84 latitude and longitude coordinates.
- Add an OSM basemap to the project, then navigate to Cayenne in French Guiana at the northern coast of South America. The coordinates in the image below will help you if you have problems finding the city on the map.
- Activate the OSMDownloader button described in the previous paragraph, and then click and drag in the map canvas to select a rectangular area comprising the city. This opens the OSMDownloader dialog box shown below. If you want to use exactly the same area we use here, manually edit the upper and lower boundaries for the latitude and longitude coordinates to be the same as in the screenshot.

Figure 9.8 -
Under Save Location, press the Save File button and navigate to the folder you created in step 1. Then use cayenne.osm for the file name.
-
Click OK, which will start the download process. A progress bar will appear and finally a window informing you that the download has finished.
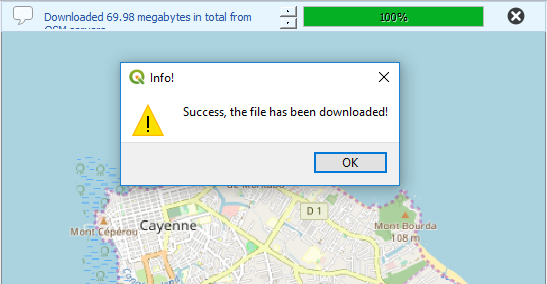
Figure 9.9 -
We are done using the download plugin now. Next, let's add the downloaded .osm file with the OSM data to our QGIS project. For this, you can simply drag the cayenne.osm file from the Windows File Explorer onto the map canvas in QGIS. The .osm file contains entities of different geometry type. However, the layer that will be added to QGIS can only contain features of a single geometry type. Therefore, you will be shown a dialog window in which you have to pick that geometry type. Since we are interested in building polygons, you should select "multipolygons" here and then click the button either called OK or Add Layers.
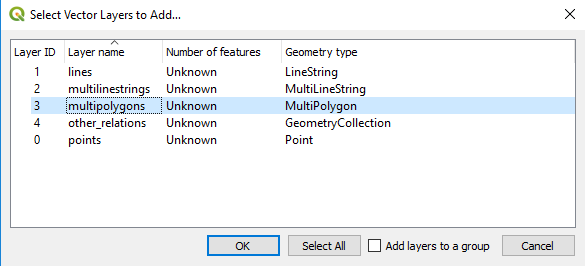
Figure 9.10 - You should see a new layer called cayenne_multipolygons appear in your QGIS project as shown in the image below.
Now you just need to select only the building polygons from this layer.
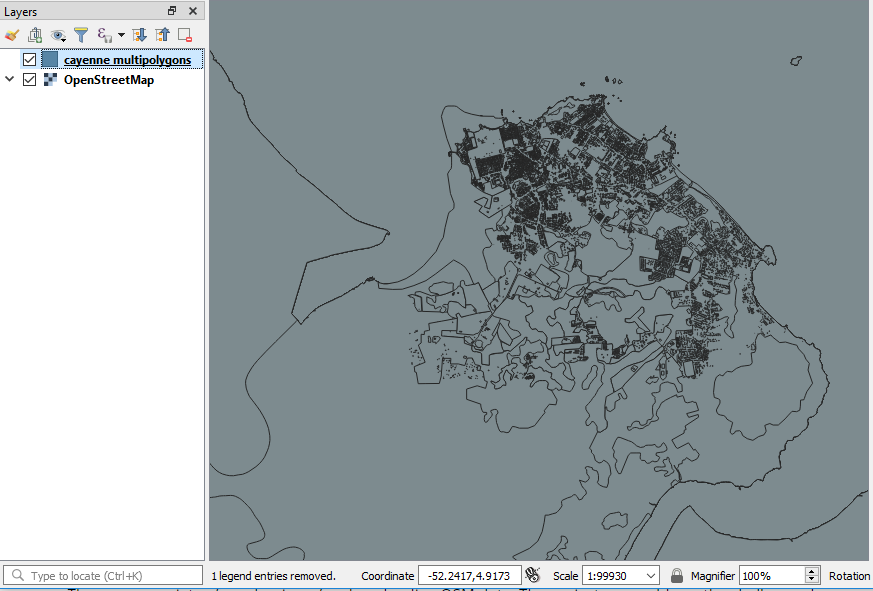 Figure 9.11
 - In the map table of contents, right-click cayenne_polygons and click Open Attribute Table. Have a quick look at the attribute table and check out the building column. This is what we will refer to in our query to filter the layer.
- At the top of the attribute table, click the Select features using an expression
 button.
 - Paste the following query into the Expression box, including all quote marks: "building" != 'NULL' AND "building" != 'no'
This expression filters out everything that's not a building. When you do this with your own data of interest, you'll need to create some expression that selects only the tag combinations that you want.
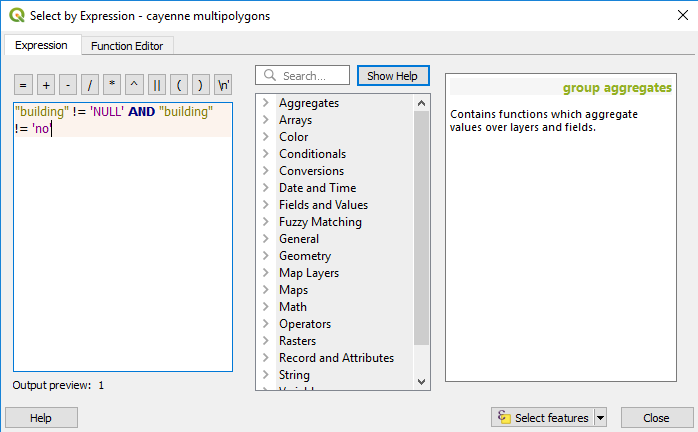 Figure 9.12
 - Click Select features. You should see the building features selected in the map.
- In the map table of contents, right-click the cayenne_polygons layer and click Export -> Save Features as....
- Choose Esri shapefile as the format and specify an output location. Select the Save only selected features option. Then click OK. (The "Add saved file to map" option will most likely appear at the very bottom of the window but should already be enabled by default.)
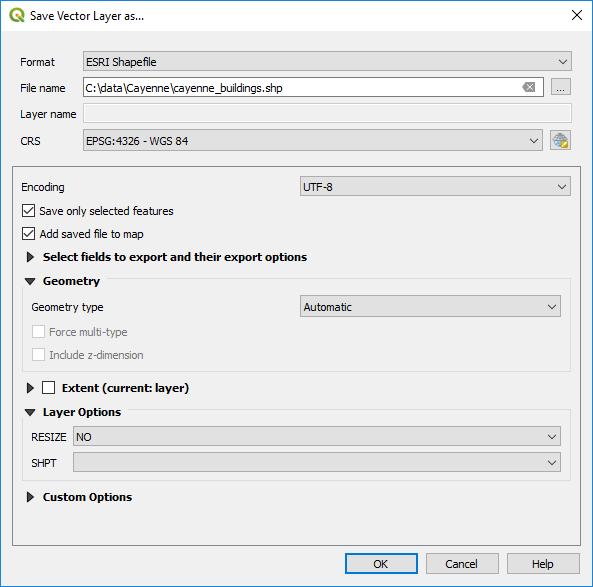 Figure 9.13
 - Use QGIS to verify that your exported shapefile contains only the buildings.
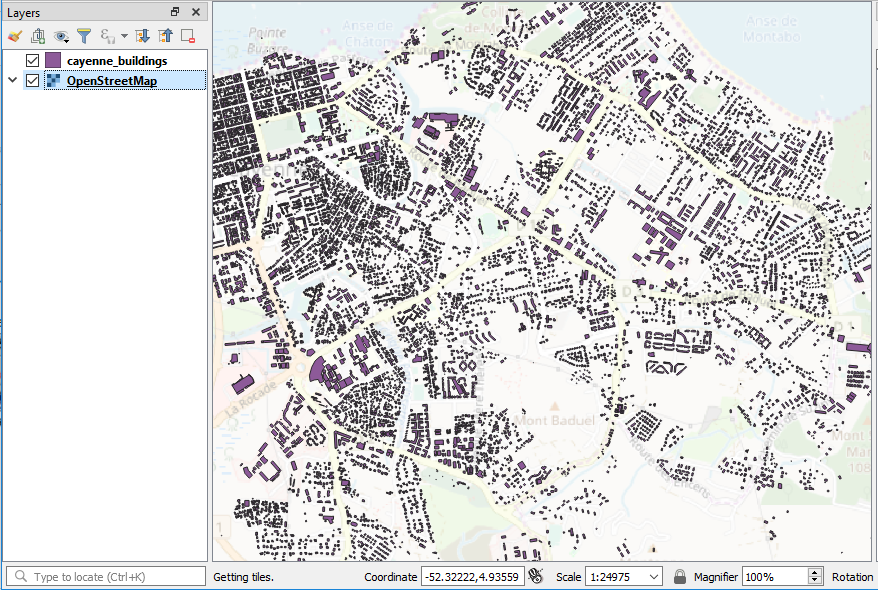 Figure 9.14
Downloading data using the Overpass OpenStreetMap query API
Behind any data retrieval mechanism from OSM is a web service request. You can send these requests directly from your web browser or an automated program using an OSM query API. One of the most powerful of these APIs is called Overpass. Try the following:
- Paste the following URL in a web browser:
http://www.overpass-api.de/api/xapi_meta?*[building=yes][bbox=-52.35,4.88,-52.25,4.98]
Notice what this is requesting...It should look familiar. - When prompted to save the file, save it as buildings.osm. It's possible that your browser will directly download and save the file under the name xapi_meta rather than asking you for a name. Therefore, if nothing happens, check your Downloads folder, and if you see the file, rename it to buildings.osm.
- Open buildings.osm in a text editor and see what all the buildings in Cayenne look like when expressed as OSM-formatted XML.
You can use Python or other scripting languages to make these requests automatically. For example, here's how you could use Python to query OSM for all the farmers' markets in Philadelphia and save them to a .osm file. (You're not required to run this code).
import urllib

workspace = "C:\\data\\OSMdev\\"

# Make data queries to jXAPI
marketsXml = urllib.urlopen("http://www.overpass-api.de/api/xapi_meta?*%5Bshop=farm%5D%5Bbbox=-75.29,39.86,-74.95,40.15%5D").read()

# Make farmers markets file
marketsPath = workspace + "markets.osm"
marketsFile = open(marketsPath, 'w')
marketsFile.write(marketsXml)
marketsFile.close()
For Python junkies: The above code uses a library called urllib which is able to make web requests and read the responses. You just have to provide the URL for the request. So as not to be interpreted as defining a list, the "[" and "]" characters are escaped using the %5B and %5D sequences, respectively, but otherwise the query has the same syntax as the one you issued above for Cayenne buildings. The resulting XML is then written to a file using the standard Python write method.
A script like this might be useful if you wanted to update one or more datasets on a periodic basis. The script could be combined with GDAL processing to get the data into a format suitable for your web map. Recent versions of GDAL (1.10 and later) can read OSM XML and convert it to different formats, such as GeoJSON or shapefiles. (Be careful with shapefiles though, because GDAL plops most of the less common "other tags" into one field that gets cut off at 256 characters, a limitation of the shapefile format).
As an exclamation point at the end of all this geekiness, play around with the graphical tool overpass turbo for a few minutes. This gives you an interactive environment for querying OSM and seeing the results on the map. You can save any interesting result in popular formats, such as KML. This is helpful if you just want to make a one-off query to OSM for some particular feature type.
There are many circumstances and needs that can affect the way you retrieve data from OSM. Hopefully, this walkthrough has provided enough options that you can make an informed decision about how to best get the scope and scale of data you need. Now let's go to the lesson assignment, where you'll get some experience with the other side of things: putting data into OSM.