OpenStreetMap (OSM) is a digital map database of the world built through crowdsourced volunteered geographic information (VGI). OSM is supported by the nonprofit OpenStreetMap Foundation. The data from OSM is freely available for visualization, query, download, and modification under open licenses.
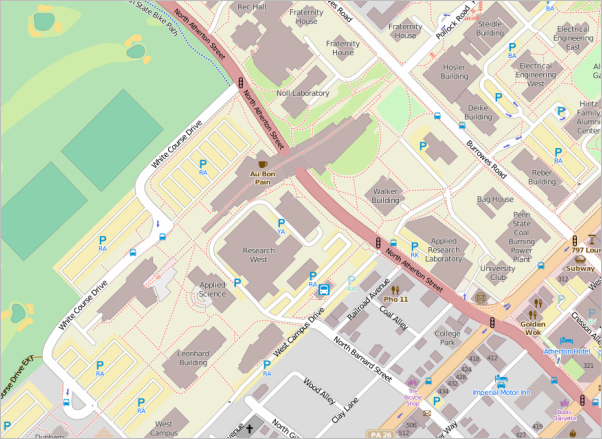
OSM works in a style similar to Wikipedia, in which virtually all features are open to editing by any member of the user community. OSM was conceived in 2004 and pretty much 10 years later reached two million registered users. Although only a fraction of these are frequent map editors, the map has matured enough in some locations to the point where its detail and precision rival "authoritative" datasets from governments and commercial entities. This is particularly true in Western Europe and some parts of the US. The image below of the Penn State campus provides an idea of the intricate features that can be submitted to OSM.
OSM originally gained popularity in places where government data was not freely available, but a thriving GIS community existed. For example, in the mid-2000s, the UK Ordnance Survey data was available only for purchase, and OSM grew rapidly as an attractive free alternative. In places where governments were willing to freely share their data, bulk upload negotiations were sometimes arranged. For example, the US has fairly thorough road coverage due to a US Census TIGER street data bulk upload.
OSM volunteer efforts constitute a social event and hobby for many, who gather for group data collection events known as "mapping parties." These activities organized armies of volunteers to walk, bike, and drive through sectors of a city with GPS units and notepads, returning later to a central lab to enter the data (Perkins and Dodge 2008). Although this is still useful in cases, nowadays, many OSM beginners can get pretty far just through tracing aerial photographs in simple browser-based editors. In addition to a physical exploration of the city, mapping parties now offer training, awareness, and renewed enthusiasm of OSM (Hristova et al. 2013).
How OSM features are contributed and tagged
To contribute a feature to OSM, you typically digitize a geometry (a point, line, or area) and then add descriptive attributes, or tags. For example, to tag a grocery store, you trace its building footprint and tag it with shop=supermarket. There's no restriction on the tags you can use, but the data is only useful to the degree that you tag things consistent with the way other OSM users have applied the tags.
To promote consistency in tagging, the OSM community has an informal tag voting and approval process organized on the OpenStreetMap wiki site. Approved tags are added to the online documentation so that others can easily find and apply them. For example, the tag shop=supermarket denotes a grocery store. Before you add a tag, check the wiki to make sure that you're using the established tag and syntax. If you create your own tag and start using it on many features, consider putting it through the OSM proposal process.
Benefits and weaknesses of OSM
OSM is not the only crowdsourced VGI project, but it is one of the most well known. As such, it provides a useful exemplification of the pros and cons of crowdsourcing and VGI.
Some of the main benefits of OSM include:
- There is no cost to use the data. In some locales, OSM may be the only freely available source of high-resolution GIS vector data. In other places, it may be the only source of data.
- The source data is available for download and use in derived cartographic products. Here, OSM differs from the crowdsourcing mechanism that Google Maps deployed, called Map Maker. Cartographers cannot download and re-use Google Map Maker data; whereas OSM is available to anyone with enough technical know-how to get the data.
- Because OSM allows people to add any type of feature, it may include a richer and more socially valuable set of features than commercial or government maps. Possibilities include trees, wheelchair ramps, food banks, spigots for potable water, and so forth.
- OSM data is flexible and can quickly be updated in the event that a new business opens, a bridge gets washed away, etc. In contrast, commercial and government maps tend to be updated on fixed cycles.
Some of the main challenges of OSM include:
- There is no systematic quality check performed on the data. You use the data at your own risk and should exercise care when using OSM information for mission-critical functions.
- The detail, precision, and accuracy of OSM coverage varies across space, without a simple means of detecting the variation. In the global South, some cities are missing basic street data, let alone other useful features such as parks, schools, and civic buildings. The Missing Maps project, heavily promoted by the American Red Cross, is one organized effort attempting to address this situation.
- OSM is subject to contributor biases. Each contributor must make decisions about the types of features he or she will place on the map and the places he or she will map. Looking at the map of any given place on openstreetmap.org, we have little idea of who created the map and why. The browser-based tool Crowd Lens for OpenStreetMap attempts to offer a window into the crowd that created OSM in a particular place. It shows that some places have garnered much more attention than others.
- The OSM community decides the types of features that are worthy of the community tagging system. This is accomplished through a semi-formal proposal and voting process which tends to reflect the interests of the contributors. In 2013, Stephens lamented that there were multiple tags for marking sexual entertainment venues in OSM, whereas proposals for tags denoting hospice services and daytime childcare had floundered. She attributed this directly to the fact that a significant majority of OSM contributors are male. Recent speakers at OSM conferences have raised attention to the consequences of gender and other imbalances in OSM, and have provided suggestions of how to make the OSM community more diverse.
- Unless you're just viewing the default map tiles, getting a focused set of data out of OSM often takes a lot more technical skill than getting the data in. Data ingress and retrieval techniques are covered in the lesson walkthrough and assignment, where you can judge this point for yourself.
Uses of OSM
The most basic use of OSM is to retrieve its map tiles as a background for other thematic layers. High-profile sites using OSM in this way include Foursquare, Craigslist, and Wikipedia. Some web developers switched to OSM as a basemap after the Google Maps API introduced potential fees into its terms of service.
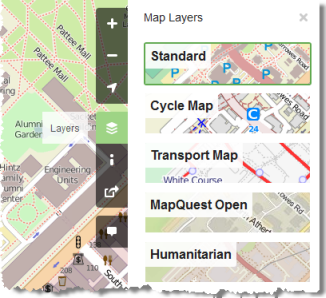
From a technical perspective, anyone can use a rendering engine like QGIS or Mapnik to draw tiles of OSM data. In fact, this is what you did with QGIS in the Lesson 5 walkthrough. The image below shows how you can select various basemap renderings on OpenStreetMap.org. Other companies such as Mapbox have made their own OSM renderings that can be consumed as web services. In fact, Mapbox's business model has come to rely so heavily on OSM that the company has invested in near-real-time quality monitoring of incoming OSM edits by hosting OSMCha, an OSM Changeset Analyzer tool originally written by Wille Marcel in 2015 (you need to sign in with a OSM account to be able to use the tool).
Let's now take a look at some of the ways OSM can be used "beyond the basemap."
Crisis response
OSM gained publicity as a disaster response aid in 2010 after the Haiti earthquake, as described in this PSU Geospatial Revolution video. Prior to this disaster, publicly available digital data for Haiti was sparse, and OSM was limited to major roads and a handful of other features. In the weeks following the earthquake, Internet volunteers worldwide traced imagery and referenced out-of-copyright maps to create a detailed geographic database of the country in OSM. This provided helpful basemaps for humanitarian aid workers who were flocking to the country and needed maps to get around. It also served as an inventory of hospitals, churches, civic facilities, and other resources that could be used by responders.
The growth of OSM during this period was nothing short of dramatic, and a number of animations such as this video: OpenStreetMap - Project Haiti have depicted the expansion of the map in Haiti during this time period. Zook et al (2010) offer an analysis of various methods of VGI and crowdsourcing used in the earthquake response, including OSM and the crisis mapping site Ushahidi.
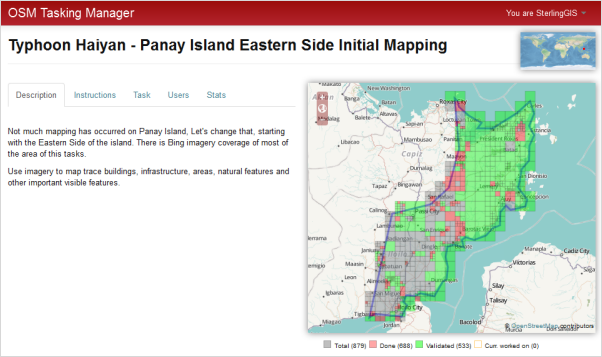
Crowdsourced volunteer efforts work most efficiently when there is an organizing force behind the work. Using lessons from the Haiti experience, the Humanitarian OpenStreetMap Team (HOT) now provides this function. After Typhoon Haiyan hit the Philippines in 2013, HOT provided tools to explain and partition the volunteer mapping work on OSM so that the most needed features and geographic areas were given priority. Volunteers visiting the HOT site could click a map sector to work on, and were given instruction about which features to trace and how to tag them. The image below shows the OSM Tasking Manager, an application used by HOT to catalog sectors completed and sectors that need work.
Providing a presence for unmapped or undermapped areas
The efforts to rapidly assemble crisis mappers in Haiti and the Philippines are admirable, but the ideal situation would be to already have the OSM data on hand. These regions only needed the mapping because sufficient information hadn't been contributed in the first place. Lack of technical infrastructure, a shortage of human and monetary capital, civil restrictions, and other factors can cause places to remain unmapped. Graham (2010) calls these places "virtual black holes" in VGI. Unfortunately, commercial Internet maps may also neglect these places if it is believed the search and advertising functions related to the map will not produce sufficient revenue to justify the investment.
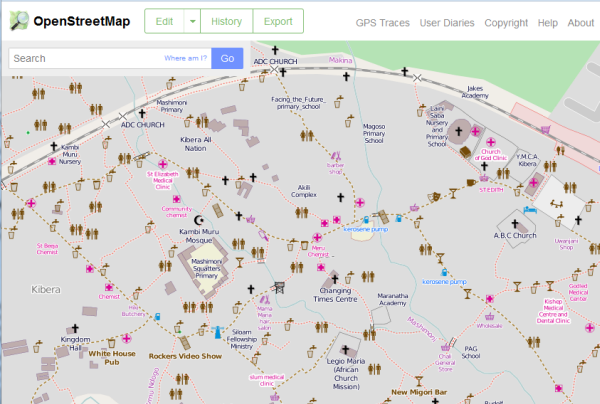
OSM has been used as a way to give a presence to communities that have previously remained unmapped. Hagen (2010) describes a project in Nairobi wherein local youth volunteers were enlisted and trained to map the sprawling slum of Kibera. Home to hundreds of thousands of people, this settlement was little more than a name on previous maps. The Map Kibera effort used OSM tools to record water points, toilets, clinics, schools, pharmacies, places of worship, and NGO offices. The result is a map that the residents can use to find local services and lobby the government for infrastructure support. The features added through this project are immediately apparent when you navigate to Kibera using even the default OSM map.
Similar stories can be found elsewhere in the world. When participants in a Buenos Aires hackathon wanted to map social services in a local slum, they found the area empty in commercial maps and decided to use OSM as a basemap. Even when a street network exists, other layers such as bus routes may be helpful for individuals without automobiles, opening possibilities for local travel outside of daily routines. Motivated individuals have headed up an OSM project with bus routes in India, noting that a detailed local map can also help with tourism promotion efforts.
Thematic mapping for the social good
One of the advantages of OSM is its flexibility to store any type of feature, given the many tags that already exist and the community-based tag proposal and voting process. In some cases, specialized thematic maps have been created around a subset of feature types. Examples of these include:
- OpenCycleMap, specializing in drawing bicycle trails that people have submitted to OSM
- OpenSkiMap, showing ski lifts and trails
- Wheelmap, allowing the browsing and marking of wheelchair-accessible locations
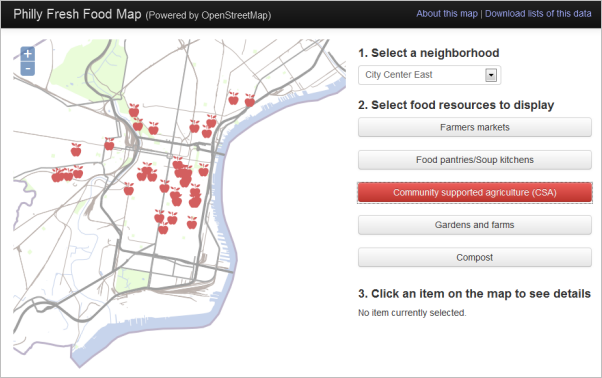
- Philly Fresh Food Map, displaying urban farming resources and fresh food distribution outlets in Philadelphia, Pennsylvania. (This should look familiar!)
In these maps, OSM acts as a freely accessible repository for local knowledge of useful things. Some of these mapped features provide great value to a community, but are not monetarily lucrative and may be excluded from proprietary commercial maps. Even the default OSM tiles do not show all the above types of features because to do so would cause the map to be cluttered. There is a great need for developers who can retrieve custom subsets of data from OSM and display it in thematic maps.
Remember that thematic maps are only possible because OSM allows free download and re-use of the data. Sites that use OSM for thematic mapping often rely on one of the various query APIs available for OSM, such as the Overpass API that allows the submission of custom tag queries through a web service. Asking a web service to give you all features matching a certain tag is often more manageable than downloading the entire OSM dataset for a region. You will get a taste of the Overpass API in the lesson walkthrough.
The maps and queries depend heavily on users maintaining consistency with established tag syntax. For example, the Philly Fresh Food Map relies on tags described in the Food Security page of the OSM wiki.
References
- Graham, M. (2010). Neogeography and the palimpsests of place: Web 2.0 and the construction of a virtual earth.Tijdschrift Voor Economische En Sociale Geografie, 101(4), 422–436.
- Hagen, E. (2010). Putting Nairobi’s Slums on the Map. Development Outreach | World Bank Institute, 41 – 43.
- Hristova, D., Quattrone, G., Mashhadi, A., & Capra, L. (2013). The life of the party: Impact of social mapping in OpenStreetMap. In Proceedings of the AAAI International Conference on Weblogs and Social Media (ICWSM2013).
- Perkins, C., & Dodge, M. (2008). The potential of user-generated cartography: a case study of the OpenStreetMap project and Mapchester mapping party. North West Geography, 8(1), 19–32.
- Stephens, M. (2013). Gender and the geoweb: Divisions in the production of user-generated cartographic information. GeoJournal, 78(6), 1–16.
- Zook, M., Graham, M., Shelton, T., & Gorman, S. (2010). Volunteered geographic information and crowdsourcing disaster relief: a case study of the Haitian earthquake. World Medical & Health Policy, 2(2), 7–33.