Whichever approach you chose to make the Republican majority surface, the final step is to sum the estimated majorities that fall inside each new Congressional District in the newDistricts2003 layer to get a predicted outcome for the 2004 elections:
- Search for and launch the Zonal Statistics as Table tool. The settings in Figure 1.5 should work (with any necessary changes to layer names):
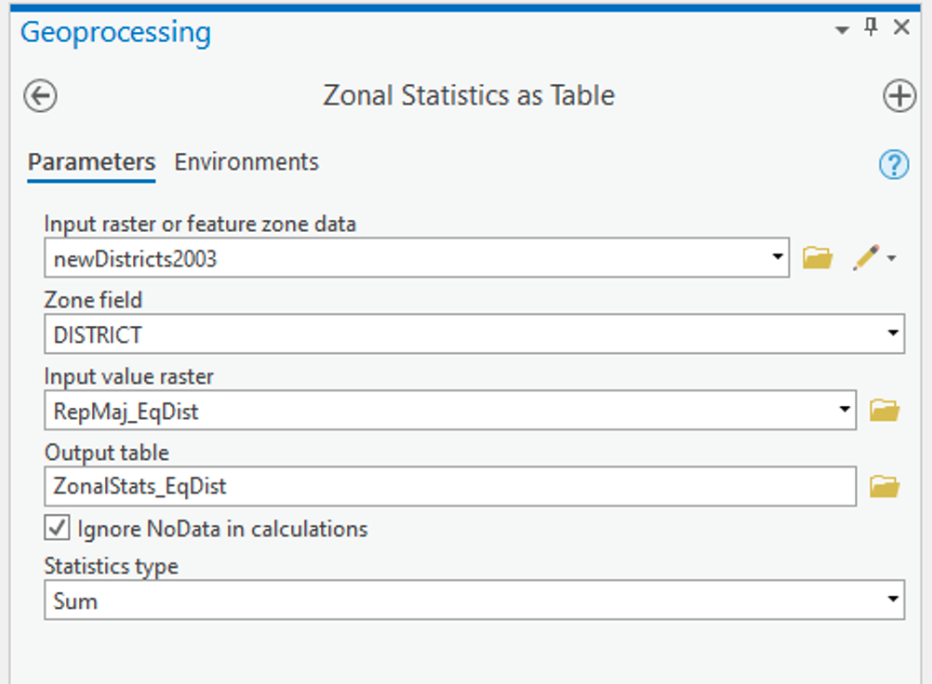 Figure 1.5: Zonal Statistics as TableClick for a text description of the Zonal Statistics as Table Example image.The input feature zone tool parameter should be set to newDistricts2003. For the zone field parameter, choose DISTRICT. The input value raster is the layer you created in the previous step. The output parameter should give the result of this tool a sensible name. Finally, the statistics type should be set to SUM.Credit: Griffin
This will make a table of values, one for each new district, which is the SUM of the Republican majority surface values inside that district.
Once you've done this summation, you should be able to join the table produced to the newDistricts2003 layer via the DISTRICT field, so that there is now an estimated Republican majority for each of the new districts. Using this new attribute, you can make a map of the 'predicted' electoral outcome for the new districts similar to the original map for the 2002 election, but based on the estimated Republican majority results.
Deliverable
You should insert this new map into your write-up. Feel free to provide additional commentary on this topic. Points to consider include:
- How does the overall outcome differ from the 2002 results?
- How many congressional races did the Republicans win in 2002?
- How many might you expect them to win in 2004 with the new congressional districts, based on your analysis?
- Is there anything about the spatial characteristics of the new districts that might lead you to think they were constructed with electoral advantage in mind, rather than fairness?
- What sort of spatial characteristics might be used to spot egregious examples of gerrymandering?
- Why did you choose the method you did to make the estimates?
- What problems do you see in the method we have used to estimate the next round of elections? (This includes weaknesses in the basic assumptions, as well as more technical matters.)