Required Reading:
Read Chapter 1: "Introduction to Statistical Analysis in Geography," from Rogerson, P.A. (2001). Statistical Methods for Geography. London: SAGE Publications. This text is available as an eBook from the PSU library (make sure you are logged in to your PSU account) and you can download and save a pdf of this chapter (or others) to your computer. You can skip over the section about analysis in SPSS.
Spatial analysis:
Refers to the "general ability to manipulate spatial data into different forms and extract additional meaning as a result" (Bailey 1994, p. 15) using a body of techniques "requiring access to both the locations and the attributes of objects" (Goodchild 1992, p. 409). This means spatial analysis must draw on a range of quantitative methods and requires the integration and use of many types of data and methods (Cromley and McLafferty 2012).
Where and how to start?
In Figure 2.0, we provided an overview of the process involved, now we will provide some of the details to get you familiar with the research process and the types of methods you may be using to perform your analysis.
Research framework
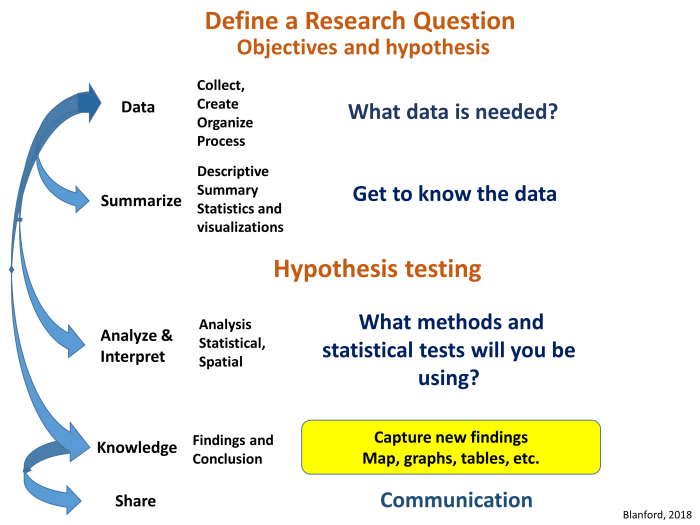
Where and how do we start to analyze our data? Analyzing data whether it is spatial or not is an iterative process that involves many different components (Figure 2.1). Depending on what questions we have in mind, we will need some data. Next, we will need to get to know our data so that we can understand its limitations, identify transformations required to produce a valid analysis, and better grasp the types of methods we will be able to use. Next, we will want to refine our hypothesis and then perform our analysis, interpret our results, and share our findings.
Statistical and Spatial Analysis
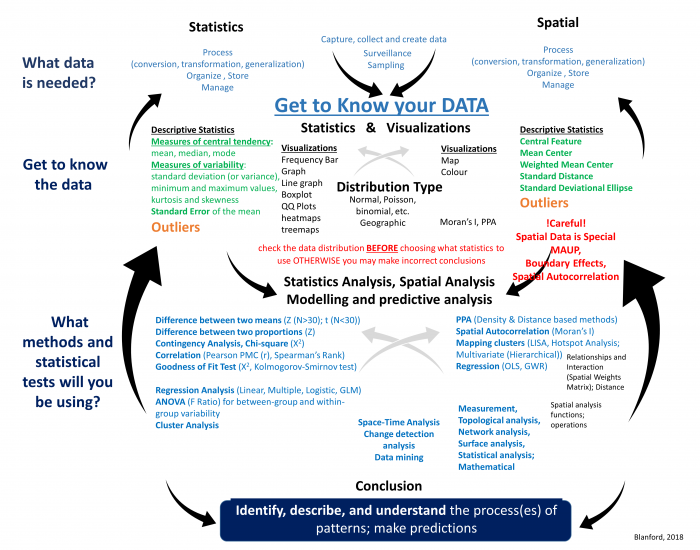
Now that you have an understanding of the research process, let’s start to familiarize ourselves with the different types of statistical and spatial analysis methods that we may need to use at each stage of the process (Figure 2.2). As you can see from Figure 2.2, statistical and spatial analysis methods are intertwined and often integrated. I know this looks complex, and for many of you the methods are new, but by the end of this course, you will have a better understanding of many of these methods and how to integrate them as you require spatial and/or statistical methods.
- Data: Determine what data is needed. This may require collecting data or obtaining third-party data. Once you have the data, it may need to be cleaned, processed (transformed, aggregated, converted, etc.), organized, and stored so that it is easy to manage, update, and retrieve for later analyses.
- Data: Get to know the data. This is an important step that many people ignore. All data has issues of one form or another. These issues are based on how the dataset was collected, formatted, and stored. Before you moving forward with your analysis, it is vital to understand
- What are a dataset's limitations? For example, you may be interested in learning about the severity of a disease across a region. The dataset you obtained contains count data (total number of cases). This count data will not give you an overall picture of the disease's impact and severity since one should adjust the case count according to the underlying population distribution (create a percent of total or incidence rate).
- Determine the usefulness of a dataset. Look at the data and determine if that data will fit your needs. For example, you may have obtained point data, but your analysis needs to operate on area-based data. Is the conversion between point to area-based data an appropriate way to answer your research question?
- Learn how the data are structured. Spreadsheets are convenient ways to store and share data. But how is that data arranged inside the spreadsheet? The data that you need may be there but the formatting is not advantageous (e.g., rows and columns need to be switched, dates need to be sequentially ordered, attributes need to be combined, etc.).
- identify any outliers. To better understand and explore the data, you can use descriptive spatial and non-spatial statistical methods as well as visualize the data either in graphs or plots as well as in the form of a map. Outliers may be signs of data entry errors or data that are atypical and depending on the intended statistical test may need to be removed from the data listing.
- Spatial Analysis and Statistical Methods. As you work through the analysis, you will use a variety of methods that are statistical, spatial, or both, as you can see from Figure 2.2. In the upcoming weeks, we will be using many of these methods starting with Point Pattern Analysis (PPA) in Lesson 3, spatial autocorrelation analysis (Lesson 4), regression analysis (Lesson 5), and the use of different spatial functions for performing spatial analysis (Lessons 6-Lesson 8). Remember, this is an iterative process that will likely require the use of one or more of the methods summarized in the diagram that are either traditional statistical methods (on the left) or a variety of spatial methods (on the right). In many cases, we will likely move back and forth between the different components (up and down) as well as between the left and right sides.
- Communication. Lastly, an important part of any research process is communicating your findings effectively. There are a variety of ways that we can do this, using web-based tools and integration of different visualizations.
Now that you have been introduced to the research framework and have an idea of some of the methods you will be learning about, let’s cover the basics so that we are all on the same page. We will start with data, then spatial analysis, and end with a refresher on statistics.