GEOG 586
Geographic Information Analysis

Overview

PrintPrint

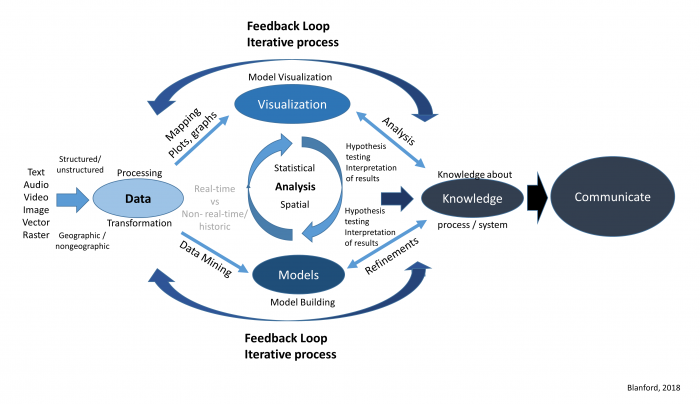
Geographic Information Analysis (GIA) is an iterative process that involves integrating data and applying a variety of spatial, statistical, and visualization methods to better understand patterns and processes governing a system.

Geographic Information Analysis (GIA) is an iterative process. See text description below
Figure 2.0: Spatial Data analysis: an iterative process.
Click for a text description of the Spatial Data Analysis image.
Spatial data analysis is an iterative process. Text, video, audio, image, vector, and raster data are can be structured/unstructured and geographic/non-geographic. This data can be processed and transformed. A feedback loop and iterative process exists between data and knowledge. This loop includes mapping, plotting and graphing for model visualization and analysis (hypothesis testing and interpretation of results). This leads to knowledge. Another path starts at data, goes to data mining, building models, and refining that model (hypothesis testing and interpretation of results) which leads to knowledge about a process/system. In the middle is a loop between analysis - statistical and spacial. Knowledge about a process/system results in the ability to communicate.
Credit: Blanford, © Penn State University, is licensed under CC BY-NC-SA 4.0

Learning Outcomes

At the successful completion of Lesson 2, you should be able to:

  • deal with various types of data;
  • develop a data frame and structure necessary to perform analyses;
  • apply various statistical methods;
  • identify various spatial methods;
  • develop a research framework and integrate both statistical and spatial methods; and
  • document and communicate your analysis and findings in an efficient manner.

Checklist

Lesson 2 is one week in length. (See the Calendar in Canvas for specific due dates.) The following items must be completed by the end of the week. You may find it useful to print this page out first so that you can follow along with the directions.

Lesson Roadmap
Step Activity Access/Directions
1 Work through Lesson 2 You are in Lesson 2 online content now. Be sure to read through the online lesson material carefully.
2 Reading Assignment

Before we go any further, you need to complete all of the readings for this lesson. 

  • Chapter 1: "Introduction to Statistical Analysis in Geography," from Rogerson, P.A. (2001). Statistical Methods for Geography. London: SAGE Publications. This text is available as an eBook from the PSU library (make sure you are logged in to your PSU account) and you can download and save a pdf of this chapter (or others) to your computer. You can skip over the section about analysis in SPSS.

  • Chapter 2 from the course text by Lloyd (Local Models for Spatial Analysis), "Approaches to local adaptation," pages 23 - 27.

  • Appendix A from O'Sullivan, D.O. and Unwin, D. (2003). Geographic Information Analysis. Hoboken, NJ: John Wiley & Sons.

After you've completed the readings, get back into the lesson, work through the interactive assignment and test your knowledge with the quiz.

3 Weekly Assignment Project 2: Exploratory Data Analysis and Descriptive Statistics in R
4 Term Project Submit a more detailed project proposal (1 page) to the 'Term Project: Preliminary Proposal' discussion forum.
5 Lesson 2 Deliverables
  1. Complete the Lesson 2 quiz.
  2. Complete the Project 2 activities - the materials for this project and where to find them are described on the 'Weekly Assignment' page.
  3. Post your preliminary project proposal to the Term Project: Preliminary Proposal discussion forum in Canvas.

Questions?

Please use the 'Discussion - Lesson 2' forum to ask for clarification on any of these concepts and ideas. Hopefully, some of your classmates will be able to help with answering your questions, and I will also provide further commentary where appropriate.