Next week, we'll hear from 2 speakers.
Speaker #1
Our first speaker will be Mr. Bill Schuman. Bill is the Sr. Vice President of Project Delivery for Transcend Spatial Solutions. His responsibilities include project manager oversight; providing subject matter expertise for road inventory, asset management, linear referencing systems (LRS), and road data models; business operations; and guiding the company’s strategic direction. He has over 28 years of transportation and GIS experience. He is a recognized LRS and transportation data expert and has worked with state and local governments on IT strategic plans, spatially enabled database and data warehousing projects, LRS design and implementation projects, and many custom data maintenance and data presentation applications.
Bill holds a B.S. in Civil Engineering from the University of Wyoming and is a GIS Professional.
Linear Referencing Systems (LRSs)
Transportation agencies capture a wide variety of information about their roadways in addition to information about assets or occurrences along their roadways. Some of these attributes relate to a specific location (e.g., crashes) while other attributes relate to a section of roadway (e.g., speed limit). Collectively, these point or linear attributes are referred to as events.
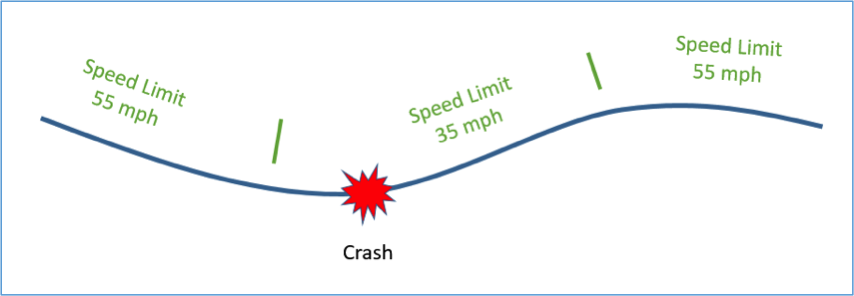
The large number of events which need to be associated with the geometry of the roadway creates a challenge due to the fact that they often change values at different locations. For example, the locations where speed limit changes occur generally doesn’t correspond to the points where changes in pavement type, the number of lanes, or the condition of the roadway occur.
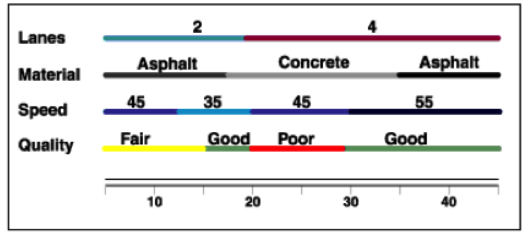
Consequently, if we were to attempt to segment the roadway in such a way to ensure all attributes were constant over the length of each segment, we would wind up with a highly segmented roadway. Alternatively, if we were to create a separate linear feature class for each roadway attribute, we would have a large number of feature classes that would need to be maintained. One solution to this problem is to separate the events data from the route geometry and maintain them in separate tables which relate to the route geometry according to the route name and a linear measure (for point events) or pair of measures (for linear events) which indicate the location of the event along the route.
There are many different ways one can locate an event along a route. For example, an event could be located according to its distance along the route in miles from the county line. Alternatively, the distance could be measured from the beginning of the route or some other established marker or datum. These different approaches are referred to as Linear Referencing Methods (LRMs).
Given the relationship between the events in the events table and the route features, GIS software can dynamically create feature classes for any specific event or combination of events. This process is known as dynamic segmentation. The standard set of geoprocessing tools can then be applied to these dynamically generated features just as they can be applied to a persistent feature class.
The entire system which an organization uses to allow for the separation of event data and dynamic generation of feature classes is known as a Linear Referencing System (LRS). LRSs have been used extensively with road networks, but they are applicable to other types of linear networks as well, including pipelines and hydrologic networks.
Speaker #2
Our second speaker will be Mr. Derald Dudley. Derald is a geographer and computer scientist in the Office of Spatial Analysis and Visualization (OSAV) which is part of the USDOT's Bureau of Transportation Statistics (BTS). He also chairs the Federal Geographic Data Committee (FGDC) Transportation Subcommittee.
BTS and the National Transportation Atlas Database (NTAD)
In April 1994, then-President Bill Clinton signed Executive Order 12906 titled “Coordinating Geographic Data Acquisition and Access: The National Spatial Data Infrastructure.” Since then, the FGDC together with their partner organizations have developed and revised a strategic plan to advance the National Spatial Data Infrastructure (NSDI). The most current version of the plan can be found here. The USDOT’s Bureau of Transportation Statistics (BTS) is responsible for overseeing the transportation components of the NSDI through the National Transportation Atlas Database (NTAD). Take some time to familiarize yourself with BTS and the NTAD. Also, take a look at the following datasets included in the NTAD: Highway Performance Monitoring System (HPMS) and the National Highway Planning Network (NHPN). Finally, read about the National Transit Map which also generates datasets included in the NTAD.