Gantt Charts for Schedule Management
The Gantt chart is designed in timeline format, so that task timing (planned or actual timing) can easily be visualized over time. Gantt charts can be used to track and display progress of all tasks throughout the project. The Gantt chart is the most common graphical format for visualizing project timing. The Gantt is one way (or "view" of the project task sequence and timing. Other "views" that are sometimes used is a network diagram (project flow chart) and a calendar views. Gantt charts include: a list of project tasks, a timescale across the top with user-defined timing intervals (e.g., months or weeks), and bars under the timescale showing task timing.
Figure 5-2 below shows the major parts and format of the Gantt chart (with Gantt bar symbology for different task types)
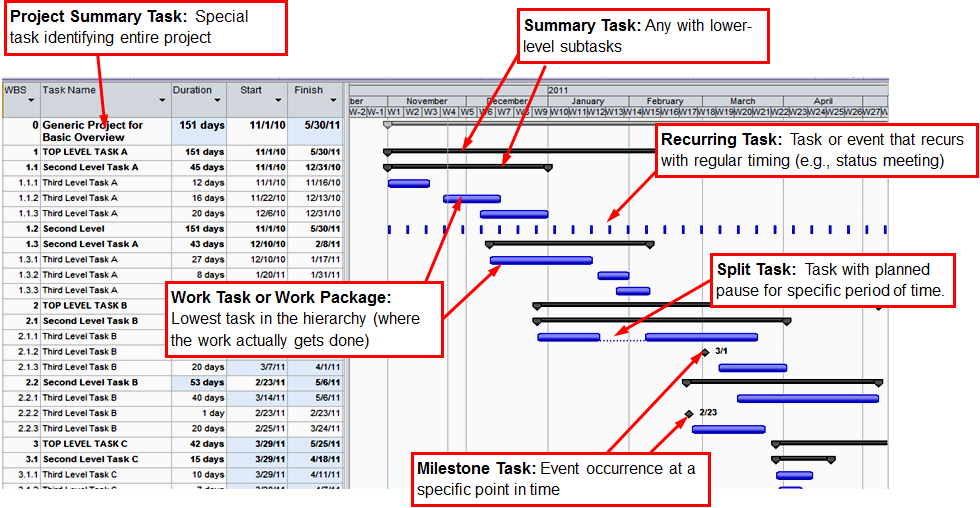
Click for a text description of Figure 5-2: Example of Gantt Chart
This figure is a diagram that shows and explains an example of a project Gantt chart used for presenting tasks and timing information for a project. The left side of the generic chart shows five labeled columns, WBS (Task Number), Task Name, Duration, Start Date and Finish Date. The right of the chart shows Gantt chart bars and symbols showing the timing of tasks. This right part of the chart has timescale headings and vertical grid lines. These heading lines have labels for the year at the top line, months on the second line, and weeks from the plan start. There are six boxes that contain text annotation explaining elements of the Chart, with arrows pointing to the related Gantt element. These annotation boxes explain the type of task symbolized in the figure. The first annotation box is in the upper left and points to the task line called with a WBS (Task) number of 0. This is called the “Project Summary Task” which is a Special type of task identifying the entire project. To the right of the first annotation box is another annotation box with the text, “Summary Task: Any with Lower-level subtasks” and points to two solid black Gantt bars below. Each of these Gantt bars spans (horizontally) multiple months. A third annotation box is below the second and has the text, “Recurring Task: Task or event that recurs with regular timing (e.g., status meeting)” and points to a blue dashed Gantt bar extending across several months. The fourth annotation box is at the middle left part of the figure and has the text, “Work Task or Work Package: Lowest task in the hierarchy (where the work actually gets done).” Two arrows from this box point to solid blue Gantt bars covering several weeks. The fifth annotation box is to the center right, with the text “Split Task: Task with planned pause for specific period of time”. The arrow from this box points to a blue bar that is split in the middle with a gap with a dotted blue line connecting the two task bars on the left and right. A sixth annotation box is at the bottom center and has the text, “Milestone Task: Event occurrence at a specific point in time”. Two arrows from this box point to black diamond-shape symbols with a specific date label.