Task Sequencing and Network Diagrams
Task Sequencing and Timing Relationships
Task sequencing reviews all activities in the WBS with the goal of identifying relationships between them and classifying all the timing relationships among tasks. These relationships (aka "linkages", "dependencies", "predecessors"). Task timing relationships are important because they control task sequencing and task start and end dates. There are four types of task relationships:
- A finish-to-start relationship exists if one activity must finish before another activity starts (most common task relationship type).
- A start-to-start relationship exists if one activity cannot start until another activity starts (2nd most common task relationship type).
- A finish-to-finish relationship exists if the one activity cannot finish until another activity finishes (3rd most common task relationship type).
- Finally, a start-to-finish relationship exists if one activity must start before another can finish (rarely used relationship type)
Why do these dependencies exist? Often they are just logical or a clear part of the project workflow (i.e., some tasks must be started or completed before some other tasks can begin). For example, in a project involving the design and development of a custom Web-based GIS application, it is necessary to complete a user requirements assessment task before beginning an application design task (a finish-to-start relationship). Or, in a project that involves the competitive selection of a contractor to perform GIS database development, it is possible to start the preparation of a request for proposal (RFP) document at the same time that proposal scoring and selection criteria are developed (a start-to-start relationship). Associated with the assignment of task relationships is the concept of a lag or a lead. Efficient project scheduling can use the appropriate application of lag and lead times along with task relationships--which adjust task duration and start and end dates. A lag time forces a task to start at a specified period of time after that defined by established task relationships. For instance, in procuring contractor services, review of proposals occurs after distribution of an RFP but with a lag of an additional 28 days after the RFP distribution (time required for vendors to submit bids). A task lead forces a task to start a specified time before that defined by the task relationship. For instance, a GIS database design task is related to the end of an information gathering task, but the design work can start before the end of that information gathering work (task lead).
By effective application of task relationships and lag and lead times, a project schedule will reflect realistic timing factors and also allow for appropriate overlap in the timing of tasks to make the best use of time.
Network Diagrams
Once all dependencies have been identified, a network diagram can be created to schematically show the sequencing of projects. In network diagrams, arrows represent tasks and are drawn to show dependencies. The completed network diagram can be used to identify the critical path of a project, the series of dependent activities that determines the shortest possible duration of a project, assuming all other milestones are met on all other paths. To find the critical path, trace all paths represented by arrows through the network diagram while summing the duration of all tasks. The greatest sum from beginning to end is the critical path. The critical path is aptly named, as a project will be behind schedule if tasks on the critical path take longer to complete than anticipated. Other tasks not on the critical path have varying amounts of slack, or time a task can be delayed without putting the completion date in danger. Figure 5-1, below, illustrates a method for determining the critical path from a network diagram.
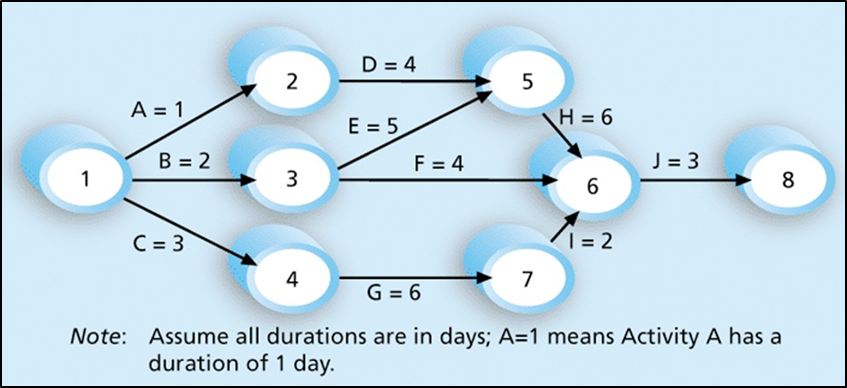
Click for text description of figure 5-1: Network Diagram Example
This figure explains the concept of a network diagram. It consists of oval shapes (numbered 1 through 8) that represent project milestone points and lines connecting the oval shapes which represent project activities (A through J) and the number of days in duration. Oval shape #1 (the start of the project) on the left side of the diagram has lines that connect it to oval shapes (milestones) #2, #3, and #4. The connecting activity lines to these shapes have the labels, "A=1", B=2, and C=3. Oval shape (milestone) #2 has one line that connects to oval shape #5 to the right, with a line labeled "D=4". Oval shape (milestone) #3 has two lines that connect to oval shapes #5 and #6 to the right, with lines labeled "D=4" and "E=5" respectively. Oval shape (milestone) #4 has one line that connects to oval shape #7 to the right, with a line labeled "G=6". Oval shape (milestone) #5 has one line that connects to oval shape #6 to the right, with a line labeled "H=6". Oval shape (milestone) #7 has one line that connects to oval shape #6 to the right, with a line labeled "I=2". Oval shape (milestone) #6 has one line that connects to oval shape #8 to the right, with a line labeled "J=3". There is text annotation below the network diagram which presents durations for specific paths of project activities. It reads:
Note: Assume all durations are in days.
Path 1: A-D-H-J Length = 1+4+6+3 = 14 days
Path 2: B-E-H-J Length = 2+5+6+3 = 16 days
Path 3: B-F-J Length = 2+4+3 = 9 days
Path C-G-I-J Length = 3+6+2+3 = 14 days
Since the critical path is the longest path through the network diagram, Path 2 (B-E-H-J) is the critical path for Project X.