2.6 Stability and Buoyancy
We know that an air parcel will rise relative to the surrounding air at the same pressure if the air parcel’s density is less than that of the surrounding air. The difference in density can be calculated using the virtual temperature, which takes into account the differences in specific humidity in the air parcel and the surrounding air as well as the temperature differences.
Stability
In equilibrium, the sum of forces are in balance and the air parcel will not move. The question is, what happens to the parcel if there is a slight perturbation in its vertical position?
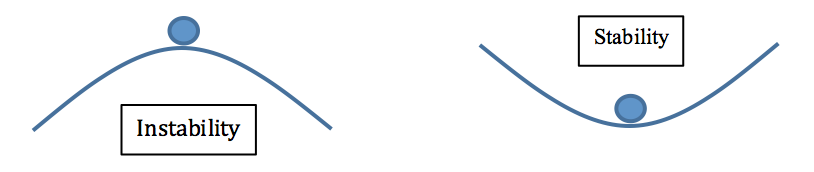
For the figure on the left, if the ball is displaced a tiny bit to the left or the right, it will be pulled by gravity and will continue to roll down the slope. That position is unstable. For the figure on the right, if the ball is displaced a little bit, it will be higher than the central position and gravity will pull it back down. It may rock back and forth a little bit, but eventually it will settle down into its original position.
To assess instability of air parcels in the atmosphere, we need to find out if moving the air parcel a small amount up or down causes the parcel to continue to rise or to fall (instability) or if the air parcel returns to its original position (stability).
Now look at some atmospheric temperature profiles. Important: a dry air parcel that is pushed from its equilibrium position always moves along the dry adiabatic lapse rate (DALR) line.
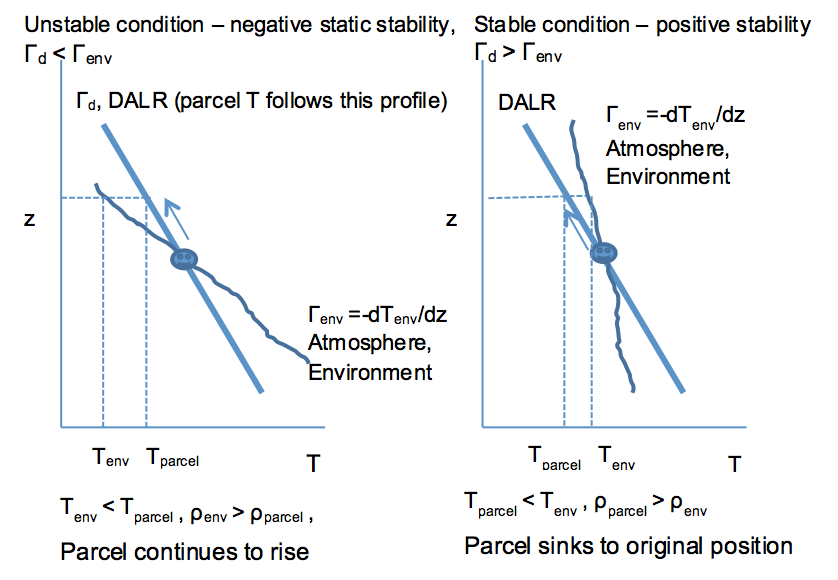
Note that we can also show that if the air parcel is pushed down, it will keep going if the atmospheric (environmental) profile looks like the one on the left and will return to the original position if it looks like the one on the right.
Check Your Understanding
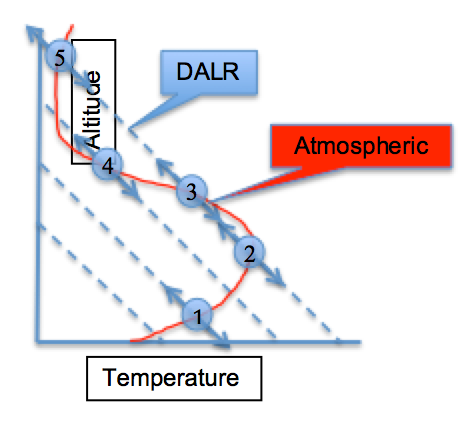
Use the image above to determine the following:
Is the air parcel stable or unstable at each of the points, 1-5?
The red line is the atmospheric temperature profile; the dashed lines are the dry adiabatic lapse rate lines (-9.8 K/km). Consider points 1-5. When an air parcel is pushed up the DALR and its temperature is greater than the atmospheric temperature at the new level, it is warmer and thus less dense. It will continue to rise. When an air parcel is pushed down the DALR and its temperature is less than the atmospheric temperature at that new level, it is colder and thus more dense. It will continue to fall. Both cases are unstable. However, if when an air parcel is pushed up the DALR and its temperature is less than the atmospheric temperature at that new level, it is colder and thus more dense. It will sink back down to its original position and is stable.
Using this thinking, air parcels at points 1, 2, and 5 are stable and at points 3 and 4 are unstable.
Buoyancy
We can calculate the acceleration an unstable air parcel will have and, from this, can determine the parcel’s velocity at some later point in time. This acceleration is called buoyancy (B).
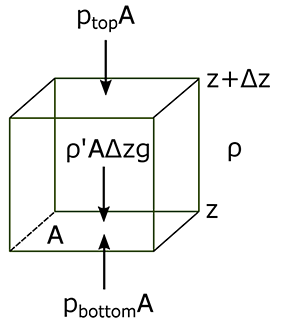
Let’s look at the forces on an air parcel again, like we did to derive the hydrostatic equilibrium. But this time, let’s assume that the parcel has a different density than the surrounding air. We will designate quantities associated with the air parcel with an apostrophe (’); environmental parameters will have no superscript.
If the forces are not in balance, then we need to keep the acceleration that we set to zero in the hydrostatic equilibrium case. We can also divide both sides of the equation by the mass of the air parcel:
where we have used the hydrostatic equilibrium of the environment to replace the expression for the pressure change as a function of height with the density times the acceleration due to gravity.
We can then use the Ideal Gas Law to replace densities with virtual temperatures because the pressure of the parcel and its surrounding air is the same:
If B > 0, then the parcel accelerates upwards; if B < 0, then the parcel accelerates downwards.
We look at the instability at each point in the environmental temperature profile and can determine Γenv for each point.
Thus,
so that:
If Γenv < Γd, the parcel accelerates downward for positive Δz (statically stable environment).
If Γenv > Γd, the parcel accelerates upward for positive Δz (statically unstable environment).
We can put this idea of buoyancy in terms of potential temperature.
We want to find dθ/dz. Taking the log of both sides of the equation and replacing a dp/dz term with –gρ, we are able to find the following expression for buoyancy in terms of potential temperature:
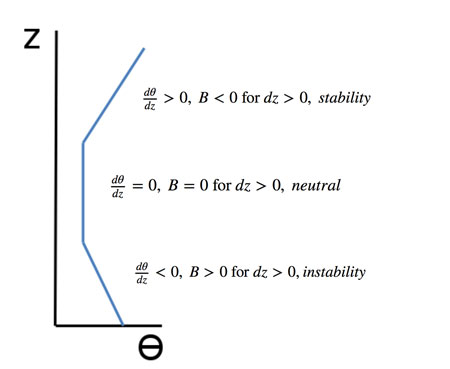
Remember that no matter what the environmental temperature or potential temperature profiles, a change in height of an air parcel will result in a temperature that changes along the dry adiabat and a potential temperature that does not change at all. As you can see below, the stability of a layer depends on the change in environmental potential temperature with height. Air parcels try to move vertically with constant potential temperature.
Parcels will move to an altitude (and air density) for which B = 0. However, if they still have a velocity when they reach that altitude, they will overshoot, experience a negative acceleration, and then descend, overshooting the neutral level again. In this way, the air parcel will oscillate until its oscillation is finally damped out by friction and dissipation of the air parcel. Note that in the neutral section of vertical profile where potential temperature does not change, it is not possible to determine if an air parcel will be stable or unstable. For instance, if the air parcel in the neutral region is given a small upward push, it will continue to rise until it reaches a stable region.
Quiz 2-4: Stability and buoyancy.
This quiz provides practice determining stability or instability of an air parcel and in calculating the buoyancy of air parcels.
- Go to Canvas and find Practice Quiz 2-4. You may complete this practice quiz as many times as you want. It is not graded, but it allows you to check your level of preparedness before taking the graded quiz.
- When you feel you are ready, take Quiz 2-4. You will be allowed to take this quiz only once. Good luck!
Discussion Forum 1: Storms in the troposphere
(3 discussion points)
This week's discussion topic is a hypothetical question involving stability. The troposphere always has a capping temperature inversion–it's called the stratosphere. The tropopause is about 16 km high in the tropics and lowers to about 10 km at high latitudes. The stratosphere exists because solar ultraviolet light makes ozone and then a few percent of the solar radiation is absorbed by stratospheric ozone, heating the air and causing the inversion. Suppose that there was no ozone layer and hence no stratosphere caused by solar UV heating of ozone.
Would storms in the troposphere be different if there were no stratosphere to act like a capping inversion? And if so, how?
Use what you have learned in this lesson about the atmosphere's pressure structure and stability to help you to think about this problem and to formulate your answer and discussions. It's okay to be wrong, as long as you have some solid reasoning to back up your ideas. My goal is to get you all to communicate with each other and think hard about atmospheric science.
- You can access the Storms in the troposphere Discussion Forum in Canvas.
- Post a response that answers the question above in a thoughtful manner that draws upon course material and outside sources.
- Keep the conversation going! Comment on at least one other person's post. Your comment should include follow-up questions and/or analysis that might offer further evidence or reveal flaws.
This discussion will be worth 3 discussion points. I will use the following rubric to grade your participation:
| Evaluation | Explanation | Available Points |
|---|---|---|
| Not Completed | Student did not complete the assignment by the due date. | 0 |
| Student completed the activity with adequate thoroughness. | Student answers the discussion question in a thoughtful manner, including some integration of course material. | 1 |
| Student completed the activity with additional attention to defending their position. | Student thoroughly answers the discussion question and backs up reasoning with references to course content as well as outside sources. | 2 |
| Student completed a well-defended presentation of their position, and provided thoughtful analysis of at least one other student’s post. | In addition to a well-crafted and defended post, the student has also engaged in thoughtful analysis/commentary on at least one other student’s post as well. | 3 |