3.6 Understanding the Atmosphere’s Temperature Profile
Now we can begin to understand the reasons for the troposphere’s typical temperature profile. The atmosphere is mostly transparent to the incoming solar visible radiation, so Earth’s surface warms, and thus warms and moistens the air above it. This warm, moist air initially rises dry adiabatically, and then moist adiabatically once a cloud forms. Different air masses with different histories and different amounts of water mix and the result is a typical tropospheric temperature profile that has a lapse rate of (5–8) K km-1.
If atmospheric temperature profiles were determined only by atmospheric moisture, drier air masses would have lapse rates that are more like the dry adiabatic lapse rate, in which case we would expect that the skies would have fewer, thinner clouds. Moister air masses would have lapse rates that are closer to the moist adiabatic lapse rate, resulting in a sky filled with clouds at many altitudes.
But many processes affect the temperature of air at different altitudes, including mixing of air parcels, sometimes even from the stratosphere, and rain and evaporation of rain. Exchange of infrared radiation between Earth’s surface, clouds, and IR-absorbing gases (i.e., water vapor and carbon dioxide) also plays a major role in determining the atmosphere’s temperature profile, as we will show in the lesson on atmospheric radiation.The resulting atmospheric profiles can have local lapse rates that can be anywhere from less than the dry adiabatic lapse rate to greater than the moist adiabatic lapse rate. Look carefully at the temperature profile below. You will see evidence of many of these processes combining to make the temperature profile what it is.

If we average together all of these profiles over the whole year and over the whole globe, we can come up with a typical tropospheric temperature profile. According to the International Civil Aviation Organization (Doc 7488-CD, 1993), the standard atmosphere has a temperature of 15 oC at the surface, a lapse rate of 6.5 oC km–1 from 0 km to 11 km, a zero lapse rate from 11 km to 20 km, and a lapse rate of –1 oC km–1 from 20 km to 32 km in the stratosphere (i.e., temperature increases with height). Even though this standard profile is a good representation of a globally averaged profile, it is unlikely that such a temperature profile was ever seen with a radiosonde.
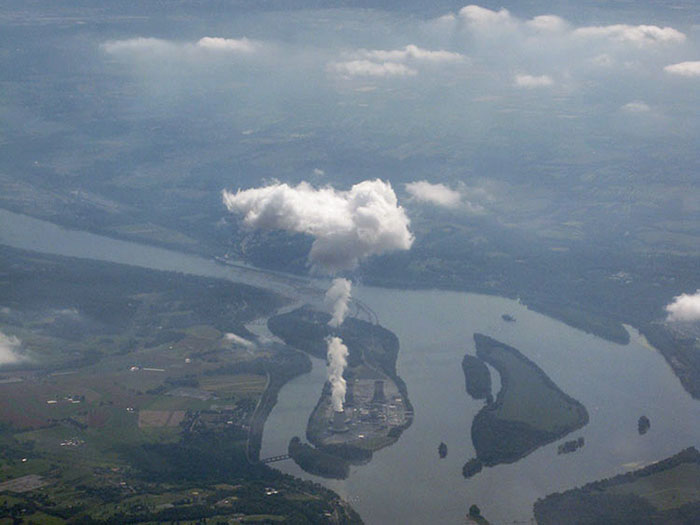
Combining knowledge of stability along with the knowledge of moist processes enables us to understand the behavior of clouds in the atmosphere. The following picture of water vapor released from a cooling tower at the Three-Mile Island nuclear reactor near Harrisburg, PA shows the water vapor quickly condensing to form a cloud. The cloud ascends, but then reaches a level at which its density matches the density of the surrounding air, the Equilibrium Level (EL). It still has kinetic energy, so keeps rising but increasingly slowly as its density becomes greater and greater than its surroundings. It then descends again, oscillating about the equilibrium level until it eventually settles there. The cloud then begins to spread out.