7.4 Applications to Remote Sensing
A second application of the principles of atmospheric radiation is satellite remote sensing (see figure below).
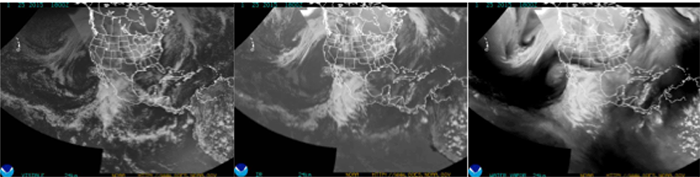
Description of the Major NOAA Geostationary Satellite (GOES) Data Products
The visible channel (0.55–0.75 μm) records reflected sunlight radiances, where whiter shades are more reflected light and darker shades are less, just like in a black-and-white photograph. Land reflects more light than oceans and lakes; clouds and snow cover reflect more light than land. The visible channel goes dark at night.
The infrared window channel (10.2–11.2 μm) is over a wavelength band where the cloud-free atmosphere is transparent. As a result, it primarily records infrared radiation emitted from Earth’s surface and clouds, with emission and absorption by the gases in the atmosphere playing a secondary role. In the figure above, the greater the surface temperature (and hence the greater the radiance or radiation energy according to Equation [6-5]), the darker the shading. Thus cloud tops, which are at higher altitudes and thus colder, appear brighter.

The water vapor channel (6.5–7.0 μm) covers a strong water vapor absorption band. Thus, radiation energy at this wavelength is strongly absorbed and the radiation energy recorded by the satellite for this channel must originate from the top of the highest moist layer. Within the moist layer, the absorptivity at this wavelength is effectively 1 and it is only near the top of the moist layer that the absorption optical thickness becomes small enough that the radiation energy can escape to space and be recorded by the satellite. Note that the higher the top of the moist layer, the lower the temperature and the less radiance recorded by the satellite. Lower radiances (and hence higher, colder moist layers) are given whiter shading; darker shading is given to higher radiances (and hence lower, warmer moist layers).
Please Note
A few remarks on the water vapor channel. Even the driest column of air will have enough water vapor to absorb all 6.5–7.0 μm infrared radiation emitted from Earth’s surface and just above Earth's surface. Therefore, all the radiation energy at these wavelengths recorded by the satellite comes from atmospheric water vapor at least a kilometer or more above the surface.
Second, in a drier column, some of the radiation energy emitted by water vapor at lower altitudes will not be absorbed by the water vapor above, thereby making it to space. Because lower-altitude water vapor has a higher temperature than the water vapor above, it emits a greater amount of infrared radiation than the overlying water vapor. Therefore, as a column dries and there is less high-altitude water vapor, the water vapor channel radiance recorded by a satellite will go up in value (or become darker) in the water vapor image.
Thus, brighter shades indicate emissions from higher altitudes and lower temperatures; darker shades indicate emissions from lower altitudes and thus higher temperatures. In no case, however, is the Earth's surface or the water vapor just above the Earth's surface observed. So whiter shades indicate more water vapor in a column at higher altitudes and can be used as a qualitative indicator of air moisture and as a tracer of atmospheric motion because the amount of moisture does not change significantly on daily time scales.