Once you have location information from a GNSS, celestial surveying, or carefully studying an Ouija Board, you’ll probably want to attach some attributes to that location data. Even if you’re only interested in mapping the boundaries of something, you’ll want to describe those locations in some way (e.g. this is a county boundary line, this is a highway with four lanes, etc…).
A typical snapshot of spatial data will look something like this.
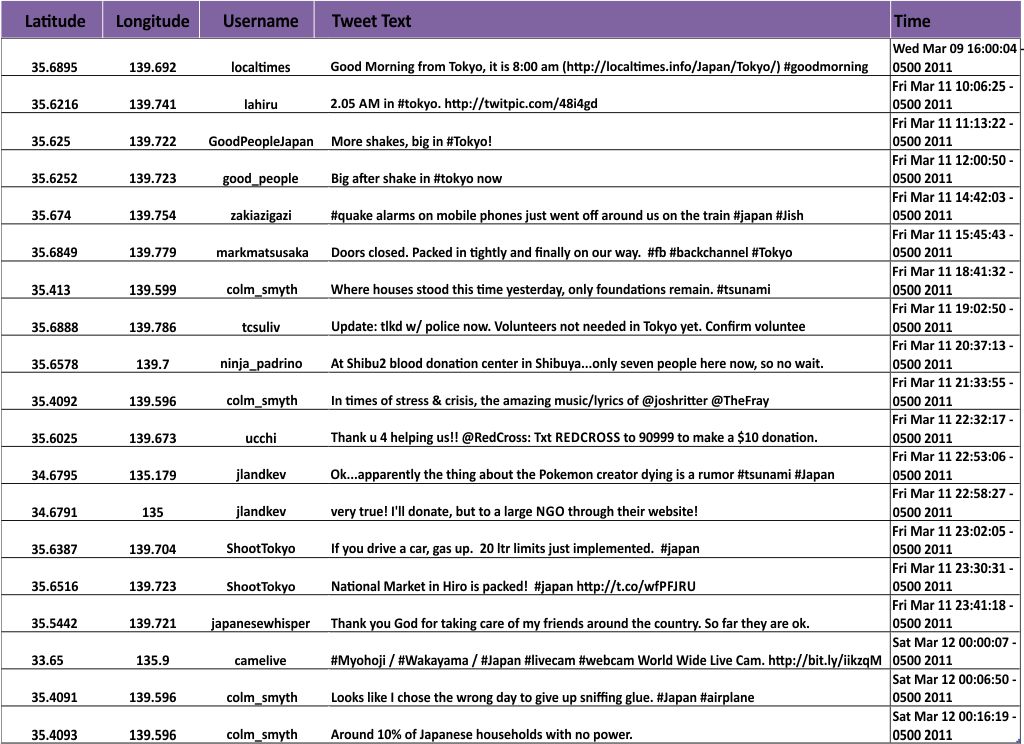
The basic spatial data items here are point locations (latitude and longitude for each Tweet). The attributes associated with each observation include the Twitter Username, the Tweet itself, and the date/time when the Tweet was posted. You could theoretically have all sorts of other additional attributes – you’d just need to define them and collect them (links to Twitter profile pictures, for example).
Beyond attributes, spatial datasets are often given broader descriptions to identify information sources, when the data was collected, its overall geographic coverage, and measurements of data quality. This data that describes the data is called metadata (have I used “data” enough in one sentence?). You often need metadata in order to understand the value of a particular spatial dataset. There are lots of existing models for defining spatial metadata, and you can read about them if you pine for incredibly boring tasks. This becomes especially important when you make a map that includes multiple layers. Let’s say I’ve got road data from the U.S. Census Bureau, World Region polygons and water bodies from Natural Earth Data (one of the best free sources for excellent geospatial data), and this set of Tweets that I want to map on top of those layers. I’d need to know how and when each dataset was created, and who created it, right?
The answers to these questions will almost always reveal that none of your data came from the same source, and none of it covers the exact same time range or level of detail. Fundamentally, mapping involves dealing with uncertainty at multiple levels. You may have to use data from multiple sources, each having its own relative quality. You may want to show the same phenomenon for two different countries, and have lower quality data for one of them.
Uncertainty sounds scary, but you deal with it every day. Weather predictions are imperfect, your recollection of what happened at last night’s office party is incomplete, and your dog may or may not have an accident on your new bedspread the day after you bought it. It’s OK. It doesn’t mean that maps are useless because they nearly always show less-than-perfect information. It just means that you should be a shrewd consumer of maps, and you should make sure you ask questions about their underlying information.