The proliferation of Virtual Globe tools like Google Earth has made imagery of the Earth more accessible than ever. This new mapping technology has also coincided with rapid advances in civilian satellite and airborne imaging systems that can provide extremely high detail images of the Earth. You can even build and launch your own little DIY Drone and create your own imagery quite easily.
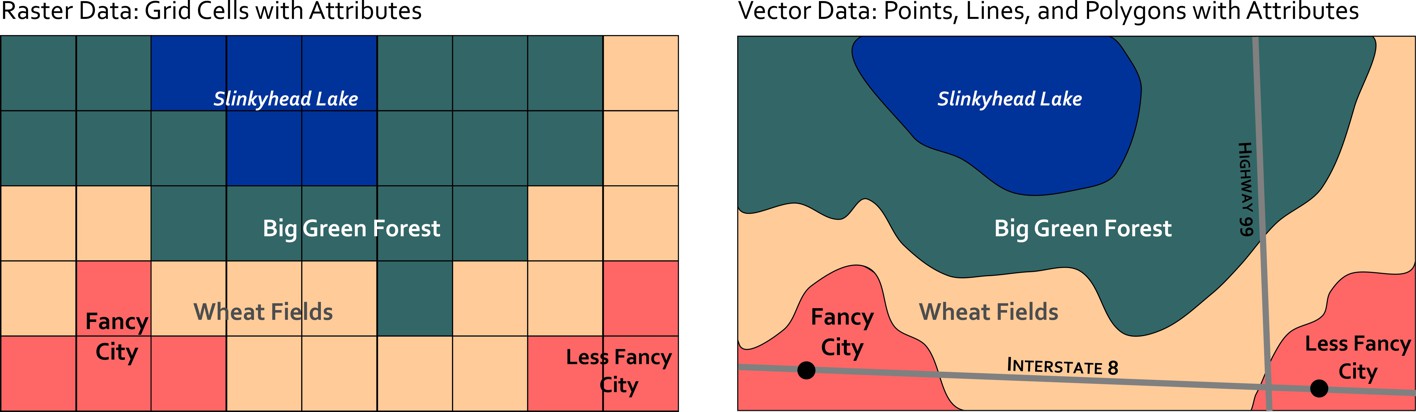
Geographic image data is raster data, which captures information by assigning values to cells in a grid. A satellite in space can detect visible light or other invisible parts of the electromagnetic spectrum (infrared heat, for example) and assign values to each grid cell to develop an image. The size of those grid cells has an impact on how much resolution (detail) you have in the final image. Some satellites have a 30 kilometer resolution, meaning each grid cell is 30 km x 30 km in size. This is fine for mapping entire countries and stuff like that, but if you want to spy on what’s in your neighbor’s back yard, you’ll need a sensor that can resolve 10 centimeters x 10 centimeters, right?
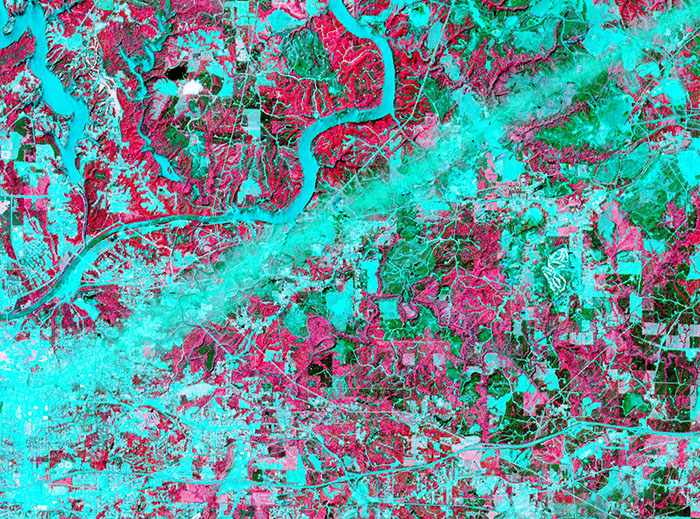
The science and technology associated with imaging the Earth from above is called Remote Sensing. It’s a thriving discipline focused on developing new ways of imaging the Earth as well as methods for interpreting and analyzing those images. In addition to the visible photography we all know and love, some sensors use radar, infrared imaging, and even lasers to create maps. Each has its own particular utility – for example, infrared imaging is often used to map the weather and land use. The infrared image shown here comes from a NASA satellite and shows the wake of a major Tornado that impacted Tuscaloosa, Alabama in 2011. The image looks kind of weird, but because infrared is not visible light, you have to assign false colors to make the image, and in this case they chose red to signify areas where vegetation exists and blue to reveal man-made features and places where there isn’t much vegetation. Both types of land use give off different infrared heat signatures that can be detected by this particular sensor.
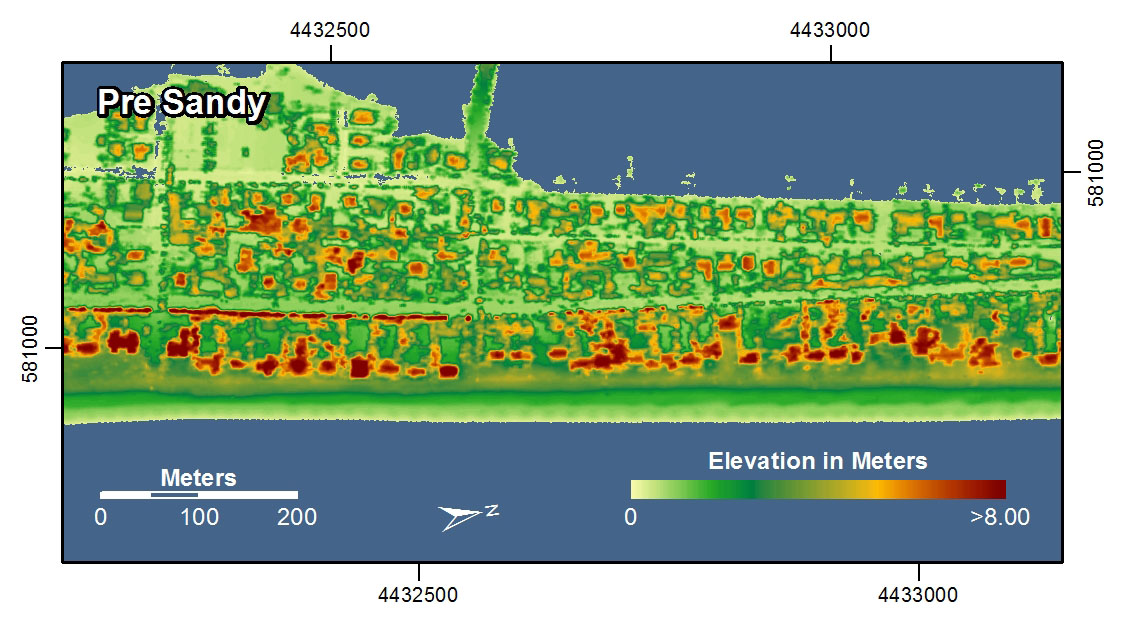
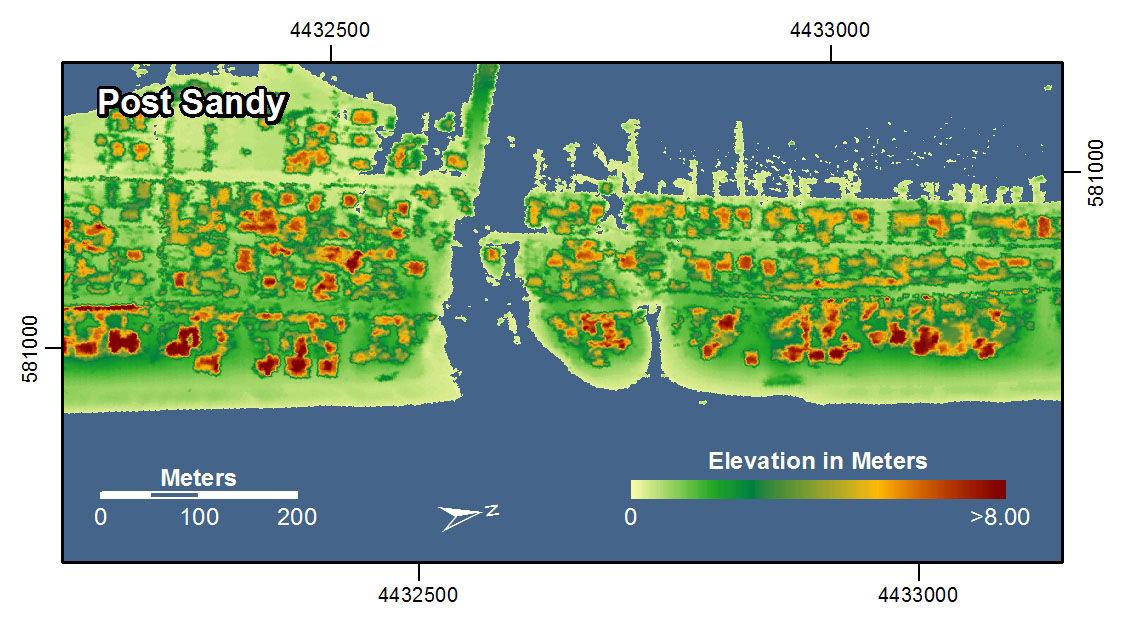
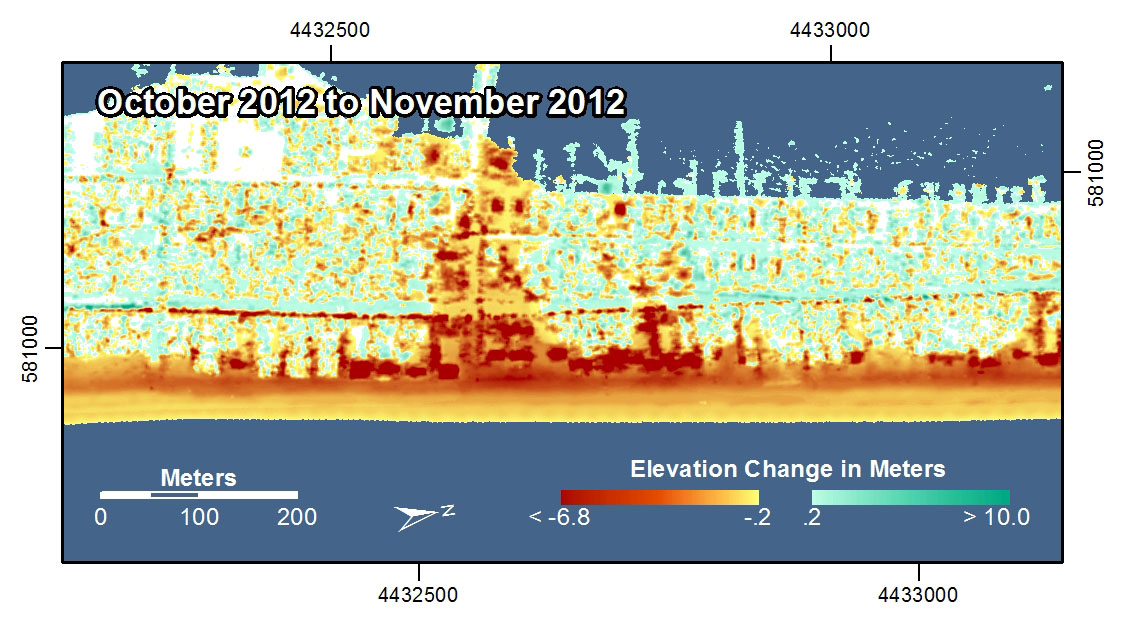
Lasers are now used for Light Detection and Ranging (LIDAR mapping). This technique is capable of generating extremely high detailed 3-dimensional models of the Earth's surface. In the examples shown here, LIDAR was used to map the coastline in New York and New Jersey before and after Hurricane Sandy in 2012. With these images you can see how it’s possible to study really intricate differences before and after the storm by using this radically precise new spatial data gathering method.
LIDAR has also been used by one of my favorite bands to make a really cool music video. If this sort of stuff intrigues you, there are great organizations in the U.S. and worldwide worth checking out that focus entirely on the science and professional practice of Remote Sensing. And, you could always take a class...