In addition to just reading the text, you may find these interactive exercises, media, and external links to be of great help in understanding and practicing certain skills.
Station Model Tool
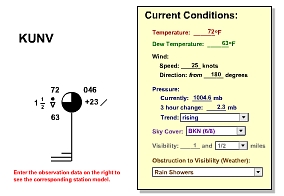
A good way to learn about how station models are coded is to use this tool. Using the Station Model Tool, explore different scenarios (of temperature, dew point, wind, and weather) and test yourself to see if you know what the station model will look like. Another good exercise is to look at an existing station model from a weather map. Here's the current map of NE station models. Decode the observation and enter it into station model tool. If you decoded the observation correctly, the tool's station model should look like the one on the map. If you want to choose a different region go to The National Center for Atmospheric Research (NCAR) Real-Time Weather Data: Surface and click on any region of the map.
Time Conversion Quiz Tool
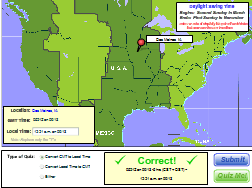
Converting time between GMT and local time is a difficult skill to learn for many folks to master. If you need more practice, use this handy Time Conversion quiz tool. Select whether you want to practice converting local time to GMT or GMT to local time (or "Either"). Then hit the "Quiz me" button. Fill in the missing time and hit "Submit" to check your answer. Just a word of caution... follow the requested format or the tool gets confused.
Wind Direction on a Polar Stereographic Map
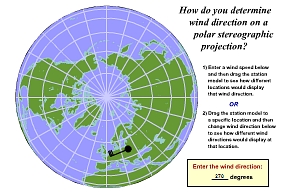
Many students find it difficult to get their sense of direction on a polar stereographic map. The Polar Stereographic Wind Direction Tool will help you practice this skill and your skill at interpreting wind direction off of a station model. Open this tool and explore what the same wind direction looks like at several different locations on a polar stereographic map. Test yourself... Can you predict what the station model with a wind from 270° will look like over central Siberia? Another approach is to look at the surface map from the National Weather Service at Anchorage, AK (it's polar stereographic). Find a station model and see if you can determine the wind direction. Check your answer by moving the station model to the proper location on the map and see if your station model matches the one on the map.
Contouring Tool
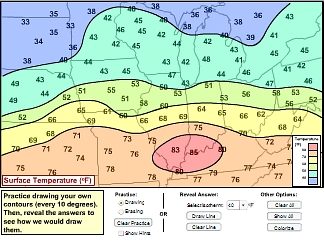
If you feel you need some "hands-on" practice check out this interactive contour tool. With this tool, you can draw your own contour lines and then compare them to how the tool draws them. If it's tough at first, use the "Show hints" button to get you started. For more advanced practice, first go to The Surface Plotting Tool and create a map of observations to contour (For example, choose "Temperature" over the "Northeast Region"). Print off the resulting map and contour it. To check your work, go to The Surface Contour Maker and make a contour plot of the same variable and region. Note: these are computer generated contours and may differ slightly from your hand-drawn ones.
3-D Hawaii
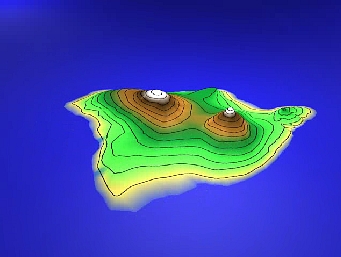
Do you have trouble visualizing contour spacing with the steepness of the gradient? If so, check out this 3-D model of the island of Hawaii (complete with contours of elevation). You can grab the model and look at it from many different angles. Notice that when elevation changes rapidly, the contours are spaced close together (and vice-verse).
Mini-Lectures...
If you're looking for a little extra discussion and some examples involving some key topics from the lesson, check out the short videos below. Note: These videos are designed to be viewed after you've thoroughly read the lesson's reading assignment.
Video transcript: The Station Model - Wind
Video transcript: Interpreting Contour Plots
Video transcript: Interpreting Gradients on Contour Plots