Complex images include images, graphs, charts, maps, etc. that cannot be described in less than 140 characters. When you use complex images, you need to describe all of the relevant information to students who are visually impaired by creating a text description. You do not need to include extraneous information, only the important information to understand the principle or learning objective of the image.
Ideal: Include all relevant information in the text so that the content can be fully understood without the image. In this case, the alt tag text would simply be a short description followed by “Diagram is described thoroughly in the text above.”
Ideal: Describe the pertinent information in the caption of the image. In this case, the alt tag text would be a short description followed by “Diagram is described thoroughly in caption below.”
Alternative: If you can not sufficiently describe the image in 140 characters, or describe it in the text, you will need to create a separate document describing the image. You will still need to include an alt tag that refers students to the text description. The text description can be in the form of text, tables or lists.
The code for a complex image is
<img alt="Graph of xyz. See link to text description below or fully described in paragraph above (below)" src="image2.jpg">
A good text description should be:
- concise
- logical
- descriptive
- pertinent to the purpose of the page
The figure below gives percentages for the top pathogens contributing to domestically acquired foodborne illnesses and deaths between the years 2000 and 2008. It is important that you are aware of the Norovirus pathogen in particular, as it is really the only pathogen of any concern that is related to Donkey Cheese production. Known as "Winter Vomiting Bug" in the UK and elsewhere, Norovirus can be nasty but causes very few deaths --- about 12% of all foodborne illness deaths. Most of the time, Norovirus just makes you wish you were dead!
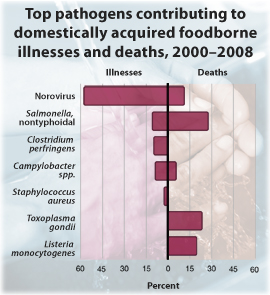
| Type of illness | illnesses (approximate) | deaths (approximate) |
|---|---|---|
| Norovirus | 58% | 12% |
| Salmonella, nontyphoidal | 11% | 28% |
| Clostridium perfringens | 10% | 0 |
| Campylobacter spp. | 8% | 6% |
| Staphylococcus aureus | 1-2% | 0 |
| Toxoplasma gondii | 0 | 20% |
| Listeria monocytogenes | 0 | 18% |