After we established that the predominant solar energy technology is mainly Photovoltaic (PV) technology, it is important to understand how PV installations are classified. PV can be classified into three main segments:
- Residential
- Non-residential (including Commercial and Community Shared solar)
- Utility scale
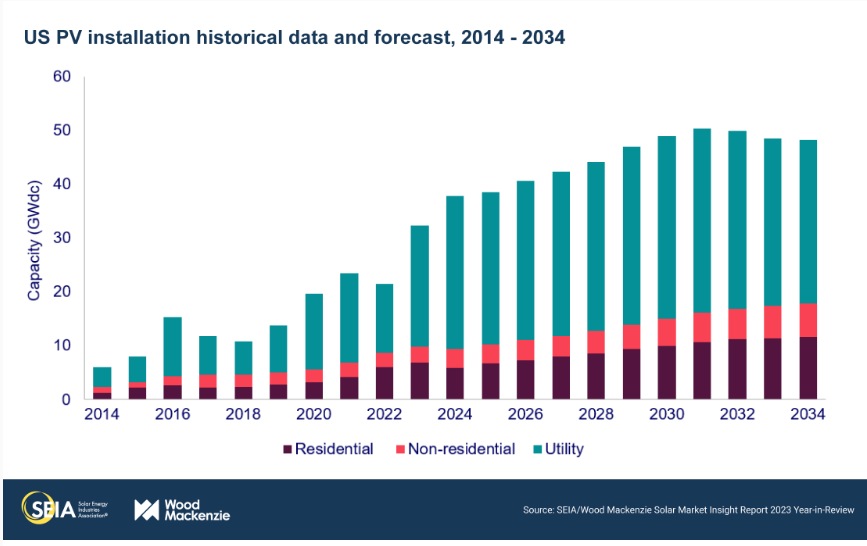
Each of these sectors has its targeted market, but it helps to understand the market share of each sector. If we track annual PV installation capacity for different solar PV sectors from 2014 to 2023, we can see, in Figure 1.5, that the PV utility scale sector has the biggest share in the PV market since 2014 and is second when it comes to the residential PV sector. We can see that the non-residential sector has leveled for several years, while both residential and utility scale installation demands are soaring.

Moving to the PV installations by state, you can see that some northeast states are big on Residential and Commercial (non-utility) PV while California, Texas, and Florida, for example, have mainly Utility scale PV installations. The question remains: why? Is utility scale solar better than residential?
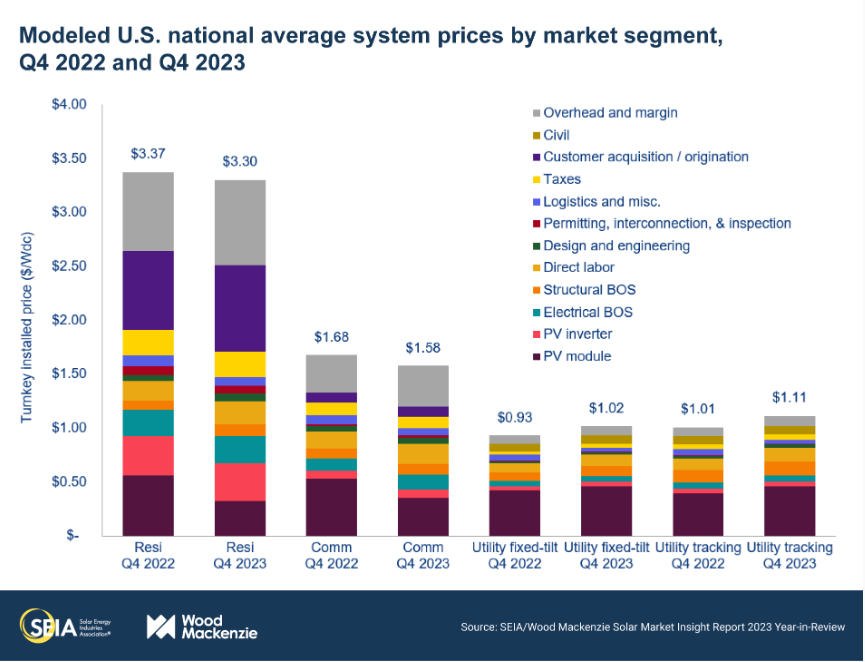
If we compare turnkey-installed PV cost per watt for different market sectors, we can see that utility scale PV installations have the lowest cost. Due to economy of scale, non-residential installations are second lowest. It can also be seen that residential installations have the highest soft costs when compared to the rest of the sectors shown in Figure 1.6. This explains why utility scale PV is more attractive to utilities and investors; we can see that the installed cost for utility scale PV is much lower than both residential and non-residential systems.

Reflection
We can also observe from Figure 1.6 that PV module price is almost the same for all sectors, and that is an important point on which to elaborate since the module is the most important piece in the PV system. As we can see from Figure 1.6, we are talking about module cost, but since all modules are made of cells, the question remains: is there a difference in cost between cells and modules? And which one of them do you look for as a solar designer? Refer to SEAI Reports in 2016(link is external), 2017(link is external), 2018(link is external), 2019(link is external), 2020(link is external), 2021 (link is external)- Table 2.5 U.S. prices.
Reflection
Zooming deeper into Figure 1.6, we can break down the cost and compare the additional costs associated with PV residential vs utility scale. Discuss these costs and why residential is more expensive compared to other segments.