Additional reading from www.astronomynotes.com
During most stages of the life of most types of stars, the star is in a stable equilibrium. What this means is that any changes to the star (e.g., in color or luminosity) are quite slow. So, for example, if you were to observe a particular red giant star tonight and then compare it to a measurement made 50 years ago, the color and luminosity of that star will most likely be exactly the same today as during the earlier observation. However, this is not true for all stars. Some stars are intrinsically variable. That is, their properties change in a periodic fashion with a short enough period for us to measure.
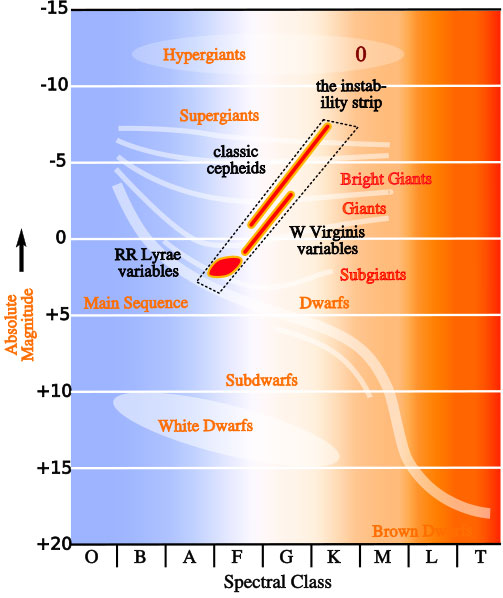
There are certain stages in the lifetimes of stars of particular masses where they are unable to achieve a stable equilibrium. During this stage, the star will, for a short time, be radiating more light than its average luminosity. The star will expand, but it will overshoot the radius where it would achieve stability. Since the star expanded, the internal pressure is reduced. Therefore, gravity will be stronger than the pressure resisting contraction, and so the star will then contract. When the star contracts, it again overshoots its equilibrium radius, thereby trapping more radiation inside the star. Therefore, its internal pressure will increase to the point that it exceeds the gravitational force contracting the star. It then expands, its luminosity increases, and the cycle repeats. It turns out that there is a certain region of the HR diagram where stars having that combination of temperature and luminosity also have the proper conditions for this pulsation to occur. That region is called the instability strip, and is labeled in the schematic HR diagram below.

There are two types of pulsating variable stars that are particularly useful to astronomers. These stars, called Cepheid variables (named after the prototypical Cepheid – delta Cephei) and RR Lyrae variables (named after the prototypical RR Lyrae – RR Lyrae) are remarkable, because their periods (the time it takes for them to go from maximum brightness to minimum brightness and back again) are directly correlated to their average luminosities. That is, if you measure their periods by observing them over the course of a few nights, you can determine their luminosity. This is another effect I would love to demonstrate with Starry Night, but unfortunately this is one place where Starry Night fails. You can see the star delta Cephei vary if you watch it carefully night after night and compare its brightness to nearby stars; however, within Starry Night it is always shown with its average brightness.
When these stars were first discovered, it was apparent that there was a relationship between their period and their apparent brightness. The work to calibrate this relationship was performed by the famous astronomer Henrietta Leavitt at Harvard College Observatory.
Want to learn more?
Henrietta Leavitt's discovery of the period-luminosity relationship (now called the "Leavitt Law") for variable stars was another turning point in the history of astronomy. The history of her work and her status as a woman working in the Harvard College Observatory in the 1890s is very interesting, and I encourage you to read more about it.
Once the distances were measured to a number of pulsating variables, the period-luminosity relationship was established. This allows astronomers to measure the period of a pulsating variable and immediately infer its luminosity without having to measure its trigonometric parallax. A plot of the period-luminosity relationship for metal-rich (type I) and metal-poor (type II or W Virginis) Cepheids is presented at astronomynotes.com.
Because of this remarkable property that the period of a variable star is proportional to its luminosity, these stars make excellent tools for measuring distances. To do so:
- Observe the Cepheid variable star for enough nights to estimate its period (that is, the time between maximum brightness) and measure its average apparent brightness.
- Use the plot of the period-luminosity, or a mathematical equation that represents the fit to the data in the plot, to determine the luminosity of the star.
- Use the standard flux / luminosity / distance equation to measure the distance to the Cepheid.
We will discuss using these stars as distance indicators more in later lessons.