Global Shale Energy Resources
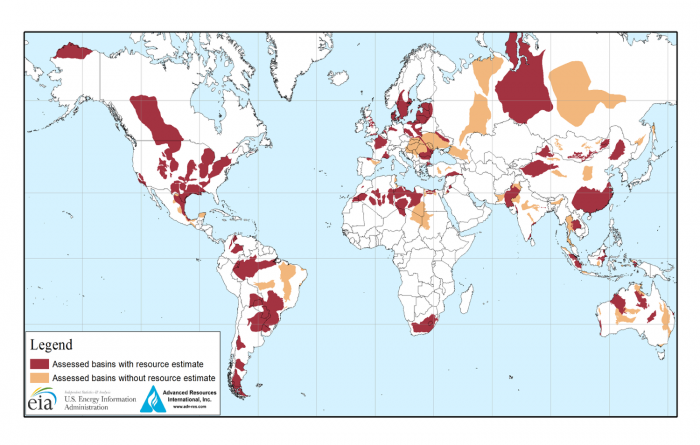
The U.S. has been leading the commercial production of shale energy resources on a global basis for over a decade, but it is not the only country with significant shale resources. According to the U.S. Energy Information Administration's World Shale Resources Assessment countries including Argentina, Algeria, and China all potentially have more shale gas than the United States, and Russia has nearly as much tight oil. Given the American transformation of unlocking shale resources, there’s plenty of motivation for these and other countries to produce their own domestic resources.
The shale gas resources assessed in the EIA’s world assessment add approximately 47 percent to the 15,583 trillion cubic feet of proved and unproven non-shale technically recoverable natural gas resources. Globally, 32 percent of the total estimated natural gas resources are in shale formations, while 10 percent of estimated oil resources are in shale or tight formations.
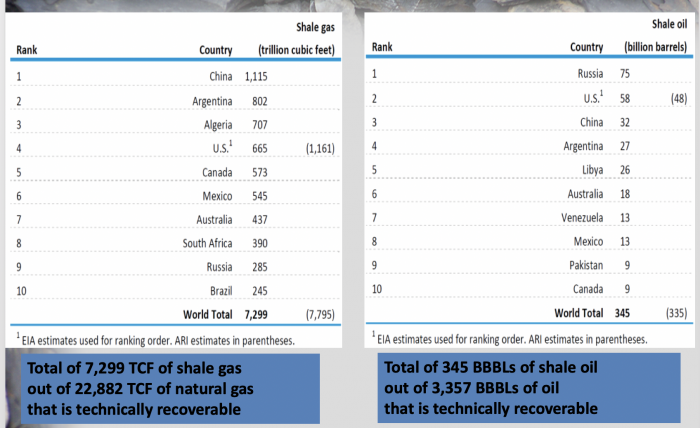
The map below shows the countries that have been assessed for their shale energy resources while the table lists the top ten countries with shale gas and oil resources.
| Rank | Country |
Shale gas (trillion cubic ft) |
|---|---|---|
| 1 | China | 1,115 |
| 2 | Argentina | 802 |
| 3 | Algeria | 707 |
| 4 | U.S.* | 665 (1,161) |
| 5 | Canada | 573 |
| 6 | Mexico | 545 |
| 7 | Australia | 437 |
| 8 | South Africa | 390 |
| 9 | Russia | 285 |
| 10 | Brazil | 245 |
| -- | World Total | 7,299 (7,795) |
*EIA estimates used for ranking order. ARI estimates in parentheses
| Rank | Country |
Shale oil (billion barrels) |
|---|---|---|
| 1 | Russia | 75 |
| 2 | U.S** | 58 (48) |
| 3 | China | 32 |
| 4 | Argentina | 27 |
| 5 | Libya | 26 |
| 6 | Australia | 18 |
| 7 | Venezuela | 13 |
| 8 | Mexico | 13 |
| 9 | Pakistan | 9 |
| 10 | Canada | 9 |
| ---- | World Total | 345 (335) |
*EIA estimates used for ranking order. ARI estimates in parentheses
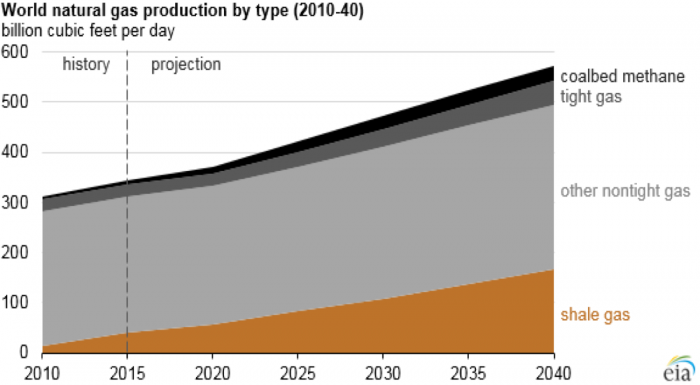
According to the EIA, global natural gas production is projected to increase from 342 billion cubic feet per day (Bcf/d) in 2015 to 554 Bcf/d by 2040 with the largest component of this growth is natural gas production from shale resources, which grows from 42 Bcf/d in 2015 to 168 Bcf/d by 2040. The chart below shows that shale gas is expected to account for 30% of world natural gas production by the end of the forecast period.
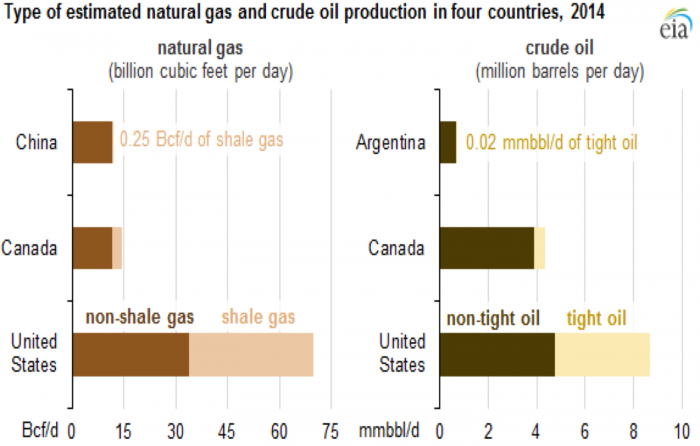
While only a few countries currently have some commercial production of shale energy resources, the number of countries and regions is expected to rise as shown in the two charts below.
| Country | Non-shale Gas | Shale Gas |
|---|---|---|
| China | 12 | .25 |
| Canada | 12 | 3 |
| United States | 33 | 37 |
| Country | Non-Tight Oil | Tight OIl |
|---|---|---|
| Argentina | .75 | .02 |
| Canada | 3.8 | .3 |
| United States | 4.75 | 4 |
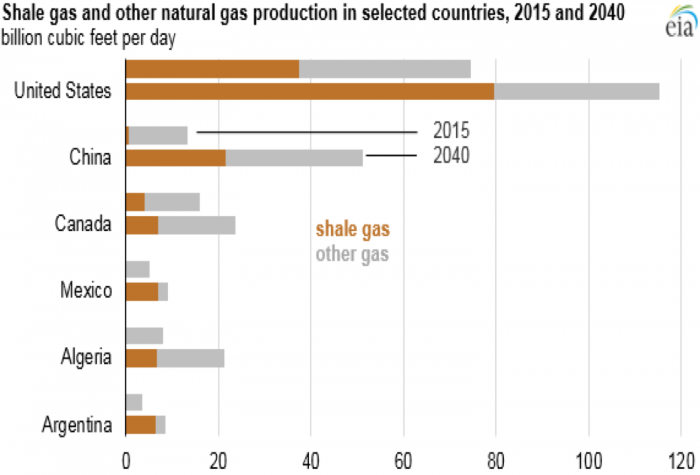
| Country | Shale Gas 2015 | Shale Gas 2040 | Other Gas 2015 | Other Gas 2040 |
|---|---|---|---|---|
| United States | 39 | 34 | 80 | 35 |
| China | 1 | 16 | 30 | 19 |
| Mexico | 0 | 5 | 12 | 2 |
| Algeria | 0 | 7 | 6 | 15 |
| Argentina | 0 | 3 | 6 | 2 |