Introduction
Energy has many advantages such as providing mobility, national wealth, power, and comfort, yet has negative consequences such as climate change, degraded air quality, and even wars. People want energy that is cheap, reliable, and environmentally benign, but we forget there are no magic bullets, and at this point in time, no single energy source alone meets all three criteria. Understanding energy systems is critical to making informed decisions about everything from deciding which household appliances to buy, locating power plants, incentivizing the use of natural gas, and drafting national energy policies.
Many Americans take their energy-intensive lifestyles for granted—unless the electricity goes off or gasoline prices reach $4 a gallon—but the commercial production of energy is relatively recent. Just 80 years ago, few rural residents had electricity. Similarly, our demand for petroleum only exceeded national production beginning in the 1950s.
It should come as little surprise that in the past 25 years, energy consumption by primary energy sources (oil, hydro, coal, gas and nuclear—to name a few) has increased throughout the world. Worldwide, electricity generation has doubled since 1980—a similar doubling is projected by 2030, according to the International Energy Agency’s World Energy Outlook. What may be surprising is who is driving that increase.
Electricity consumption in the U.S. and Europe has stayed reasonably flat over the past couple of decades and, as a percentage of world consumption, has actually fallen nearly 10 percent since 1990. In the U.S., the current rate of growth of electricity consumption is about zero—attributable to a combination of a sputtering economy and energy-efficiency/conservation awareness and programs. Still, U.S. electricity use in 2010 was more than 13 times greater than electricity use in 1950, according to the U.S. Energy Information Agency.
The growth in demand is largely from developing countries where millions and millions of people do not have access to electricity. China’s consumption is growing at about 10 percent a year. Between 2006 and 2010, China doubled its electric power system. Projections are that a similar doubling will occur in the next few years. India is embarking on similar electrification with a rate of growth of electricity consumption of about 5 percent. Estimates are that by 2030, India will have increased its power consumption fivefold. The graph below shows annual total global energy use over the last 25 years in million tonnes of oil equivalent, which is approaching 14 billion tonnes per year, a nearly 60% increase in global energy use over the last 25 years.

Three main fuels dominate the global energy picture: oil, natural gas, and coal. While OPEC—the cartel of oil-producing nations—gets a lot of press, those countries produce only about a third of oil consumed. North America, Russia, the United Kingdom and Norway together produce about what OPEC produces in a year. The remainder of world oil production comes from a large group of small producers – primarily Asian countries and former Soviet states. OPEC is not as big a player in the natural gas market. The largest gas producers in the world are Russia, the U.S., and Canada, which together produce a little less than half of the world’s supply of natural gas. As can be seen in the pie chart below, the US utilized 97.7 quadrillion Btus of energy in 2017, with 37% coming from petroleum (36.1 quadrillion Btus), 29% from natural gas (28.3 quadrillion Btus), 14% from coal (13.7 quadrillion Btus), 11% from renewables (10.7 quadrillion Btus), and 9% from nuclear power (8.8 quadrillion Btus).
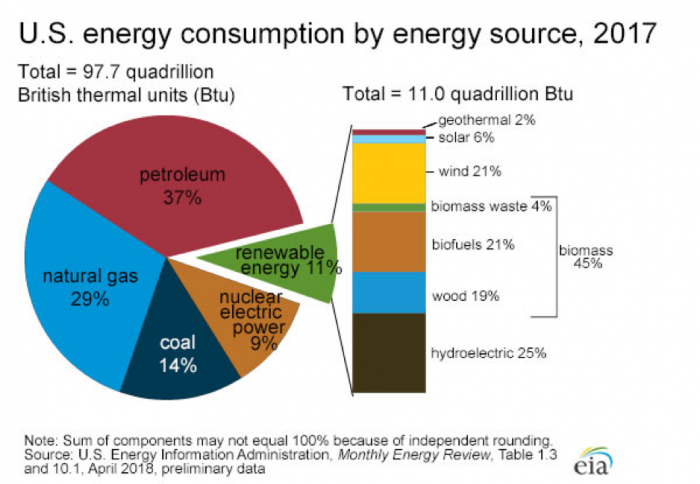
Total = 97.7 quadrillion British thermal units (Btu)
- Petroleum - 37%
- Natural Gas - 29%
- Coal - 14%
- Nuclear Electric Power - 9%
- Renewable Energy - 11% (Total = 11.0 quadrillion Btu)
- Hydroelectric - 25%
- Biomass - 45%
- Wood - 19%
- Biofuels - 21%
- Biomass waste - 4%
- Wind - 21%
- Solar - 6%
- Geothermal 2%
Note: Sum of components may not equal 100% because of independent rounding.
The two charts below show U.S. consumption and production of energy from 1950-2017. The consumption of energy has increased nearly 3-fold over this duration, from roughly 35 to 97.7 quadrillion Btus of energy during 1950-2017. The production of energy in the US currently stands at about 87.5 quadrillion Btus of energy in 2017, up from 35 quadrillion Btus of energy in 1950. Note the trends of production versus consumption over this time period. What can we conclude about how much energy we imported 1950 to present? What do you believe are some of the causes of relatively flat consumption over the last decade versus a spike in production over the same time frame?
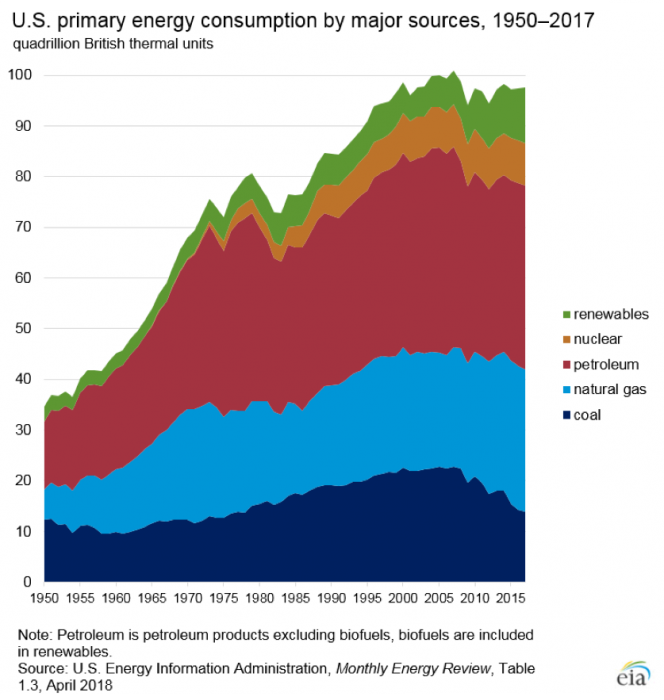
- Coal, starting (approx.) 13 quadrillion Btu & peaking at (approx.) 20 quadrillion Btu
- Natural Gas, starting (approx.) 18 quadrillion Btu & peaking at (approx.) 45 quadrillion Btu
- Petroleum, starting (approx.) 32 quadrillion Btu & peaking at (approx.) 89 quadrillion Btu
- Nuclear, starting (approx.) 32 quadrillion Btu & peaking at (approx.) 96 quadrillion Btu
- Renewables, starting (approx.) 35 quadrillion Btu & peaking at (approx.) 100 quadrillion Btu
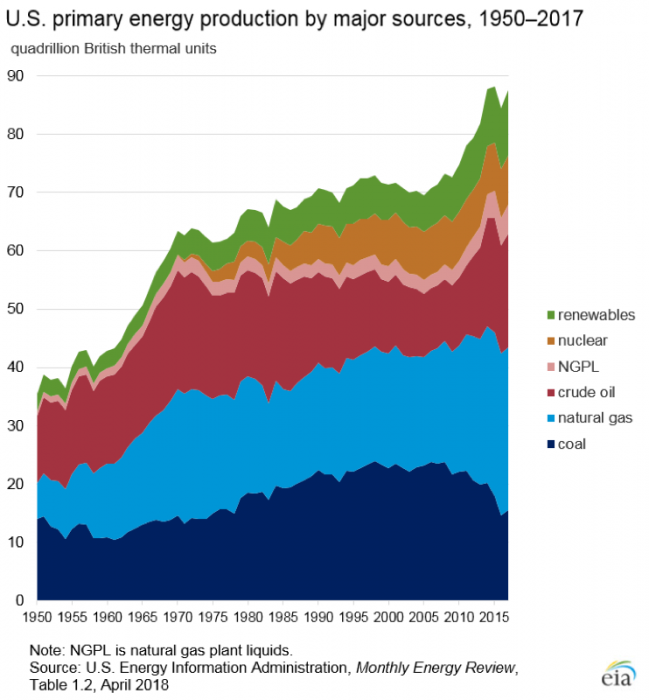
- Coal, starting (approx.) 14 quadrillion Btu & peaking at (approx.) 21 quadrillion Btu
- Natural Gas, starting (approx.) 20 quadrillion Btu & peaking at (approx.) 46 quadrillion Btu
- Crude Oil, starting (approx.) 32 quadrillion Btu & peaking at (approx.) 67 quadrillion Btu
- NGPL, starting (approx.) 34 quadrillion Btu & peaking at (approx.) 70 quadrillion Btu
- Nuclear, starting (approx.) 34 quadrillion Btu & peaking at (approx.) 89 quadrillion Btu
- Renewables, starting (approx.) 36 quadrillion Btu & peaking at (approx.) 99 quadrillion Btu
Note: NGPL is natural gas plant liquids
The U.S. has more coal than any other country in the world. This is good news for large electricity consumers since about 30 percent of U.S. electricity generation comes from coal, but bad news for the environmentally-minded who are concerned about greenhouse gases and other emissions, particulate matter, and heavy metals such as mercury. Recent federal regulations placing restrictions on a large group of pollutants (including emissions of carbon dioxide and other heat-trapping gasses) seem likely to shutter some coal-fired generation plants—and thereby, reduce some emissions. Demand for coal, however, is likely to remain strong, particularly as China and India ramp up electricity generation.
Video: Energy Choices: The SWITCH energy prime (2:51)
Every energy resource has benefits and challenges, pros and cons. So why do we choose the ones we do? It's based on four attributes: affordable, available, reliable, and clean.
First is affordable. It's hard for an expensive resource like solar to compete in the open market with a cheap one like coal. For better or worse, we make most energy choices based on price. Affordability is based partly on what we don't pay. For instance, pollution from some energies is released at no cost. Paying for these so-called externalities would raise their price and bring competing sources closer together. But if some countries do this and others don't, it creates a market disadvantage. Not an easy problem. At the moment, subsidies bring down the cost of expensive new technologies, but we can't afford to subsidize them forever. An energy that's not affordable is ultimately not sustainable.
Second is available. We tend to use what we have, where we have it. Hydro in Norway, geothermal in Iceland, solar in Spain. If it's not locally available, it needs to be easy to move. Most countries use more oil than they have, but oil has a highly developed transportation network, which has made a regional resource into a global commodity.
Reliable is next. Can we rely on a consistent supply? With oil, hurricanes and wars have sometimes disrupted that global trade. But there are bigger reliability issues. Wind and solar produce electricity intermittently. It's a major challenge. Meaning we have to back them up with a more reliable on-demand resource.
More recently, there's clean. And different countries are accepting different levels of it. Those who can afford the extra expense of cleaner energies are paying for them. While developing countries often endure more pollution, in exchange for the many benefits of cheap energy.
Every energy can be evaluated in terms of being affordable, available, reliable, and clean. The energies that best meet these four criteria will be the energies that we choose to use in the future. To hear our forecasts of which energies these will be, see the film.