Visualizing Energy Use in the United States
The economy of the United States needs roughly one hundred quadrillion Btus to function each year. One quadrillion – the number 10 followed by fifteen zeros (10,000,000,000,000,000) sounds like a huge number, and it is. One hundred quadrillion Btus is enough energy for a few hundred million trips to the moon, or to light tens of billions of light bulbs for an entire year.
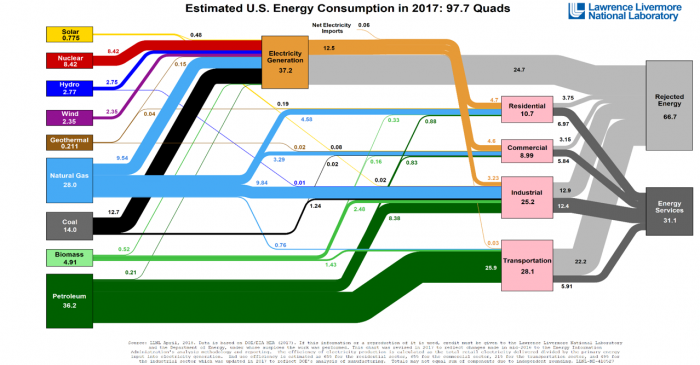
How different energy sources power different parts of the U.S. economy can be visualized using an energy flow diagram or “Sankey Diagram” like the one from the Lawrence Livermore National Laboratory (LLNL) shown below. The diagram looks complicated, but once you get the hang of it you’ll see that it contains an incredible amount of information. Watch the video below to gain a better understanding of how to read the diagram.
Video: How to read an LLNL energy flow chart (Sankey diagram) (3:02 )
So, I'm excited because this week we are releasing the 2015 version of Livermore's energy flow charts. Livermore has been producing these flow charts and publishing them since the mid-1970s and this is just the latest in a long series of charts that encompass most of what we really need to know about the US energy system. We do energy charts, we've done charts of water use in the U.S. We've done charts of the carbon emissions related to energy use.
So the chart is generally read from left to right. On the left-hand side are our energy resources, wind, and solar, nuclear energy, coal, oil, and natural gas. And energy flows from those resources through our energy system. As you can see, we use lots of different kinds of energy to create electricity and then that electricity is combined again with those other resources to power our homes, our businesses, our cars and trucks. And finally, the chart depicts how much energy is put to good use in those areas and how much of the energy passes through as rejected energy to the environment.
We're always asked what is rejected energy. Rejected energy is the portion of energy that goes into a process that comes out generally as waste heat to the environment. So, if you can think of the total amount of energy that goes into your car's gas tank, a certain amount of that goes to drive the wheels forward, that's an energy service. The energy that comes out as heat transfer from your radiator or energy and the hot exhaust out the tailpipe, that's rejected energy.
This year the chart doesn't look all that much different than it did last year. We actually used just a little bit less energy here in the U.S. in 2015 than we did in 2014. We continued to grow our use of solar energy and wind energy and, in particular, we are using a lot more natural gas and a lot less coal than we have in previous years. All of the statistics reported on this flowchart are in quads, which are quadrillion Btus. And as a matter of scale, 3,600 Btus is about a kilowatt hour. You probably pay between 10 and 15 cents for that on your electric bill. So, of the 11 quadrillion Btus of energy used in homes, each person uses about 36 million.
If you want to learn more about this story and don't forget to subscribe.
Sankey Diagram
Let’s start with the left-hand side of the diagram. Each of the colored boxes represents a specific fuel, like natural gas, coal or hydropower. (Electricity is not a “fuel” in and of itself. It is generated using other fuels, which is why electricity does not appear alongside the other fuels on the left-hand side of the diagram.) The size of the boxes represents the amount of each fuel used in the U.S. economy each year, and the numbers in the boxes represent the number of quadrillion Btus of each fuel used. For example, in 2015 the U.S. used about twice as much natural gas as coal (15.7 quadrillion Btus of coal versus 28.3 quadrillion Btus of natural gas). Thus, the size of the natural gas box is larger than the size of the coal box.
Moving from left to right in the Sankey diagram, the paths coming out of each fuel box illustrate how each fuel is used to power the U.S. economy in one of five ways:
- Generation of electric power (which is then used in buildings for heating, cooling, lighting and other uses)
- Residential: Use in homes, for example for heating and cooking
- Commercial: Use in businesses, for heating/cooling buildings
- Industrial: Use in factories and manufacturing facilities
- Transportation: Use for cars, buses, planes and so forth
The size of each of the paths describes how much of each fuel is used in each sector of the U.S. economy. The number next to each path shows the number of quadrillion Btus of each fuel is used in each economic sector. For example, if you follow the five paths out of the natural gas box you will see the following:
- 9.54 Quadrillion Btus of natural gas are used to generate electricity
- 4.58 Quadrillion Btus of natural gas are used in households
- 3.29 Quadrillion Btus of natural gas are used to in commercial buildings
- 9.84 Quadrillion Btus of natural gas are used in factories and manufacturing
- 0.76 Quadrillion Btus of natural gas are used in transportation
The Sankey diagram thus tells you that around two-thirds of the natural gas used in the U.S. every year goes to power plants and industry, while very little natural gas is used to fuel cars, buses, and trucks.
As a point of comparison, look at the boxes for nuclear and petroleum. What differences do you spot in how these fuels are used in the U.S. economy, relative to natural gas? We can see that there is only one path coming out of the nuclear box, which goes directly to the electricity generation box. This means that all nuclear fuel used in the U.S. goes into power plants. (This should not come as a big surprise – we don’t see nuclear-powered cars on the road.) Looking at the paths coming out of the petroleum box, we can see that most of the oil used in the U.S. economy goes either to industrial boilers or for transportation fuel. Very little oil is used in buildings (some people and buildings still use furnaces that run on fuel oil) and even less is used to generate electricity.
Finally, the right-hand part of the Sankey diagram reveals an awful truth about the U.S. energy system: it is incredibly wasteful. Our power plants, cars, and buildings just do not use energy very efficiently. You can see this in the two gray boxes on the right-hand side of the Sankey diagram. The darker gray box at the bottom labeled ‘Energy Services’ shows how much of the fuel from coal, oil, natural gas, wind, and so forth is actually put to useful work to move cars, light buildings and so forth. The lighter gray box labeled ‘Rejected Energy’ captures how much energy we waste because we use highly inefficient technologies in our power plants, cars, and buildings. Looking at the amount of ‘Rejected Energy’ (59.1 quadrillion Btus) versus ‘Energy Services’ (38.4 quadrillion Btus), we can see that we waste about 60% of the fuel that we use to power the U.S. economy every year. The biggest waste comes from generating electricity (where we waste about two-thirds of all the fuel we put into power plants) and from transportation (where we waste around 80%).