Production
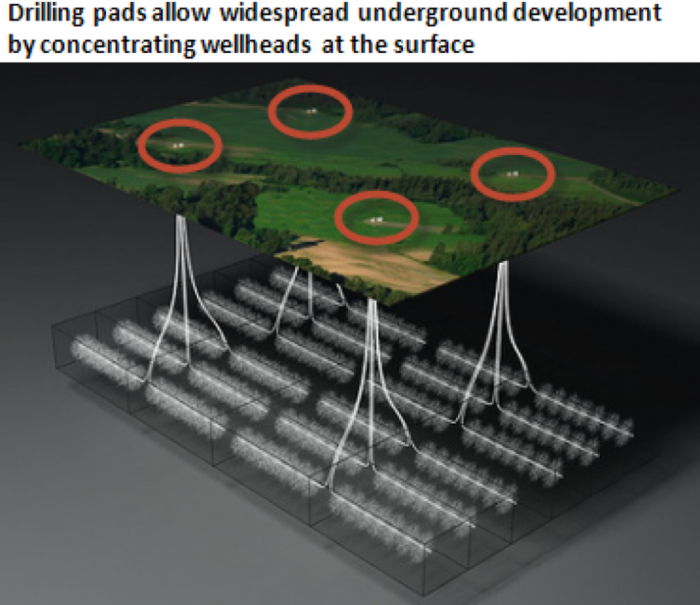
Once wells on a pad have been fractured as described in the previous section, they will be turned in line to send gas and oil to the marketplace via pipelines and refineries. The produced hydrocarbons are metered at the surface near the wellhead to calculate how much oil or gas is produced over a certain period of time to get a flow rate. Estimating the flow rate allows geologists and engineers to understand how productive the shale is and how much may be produced over time. An area of one to two square miles can be drained by six to ten wells on one well pad and ultimately determines how much gas can be produced from a well pad. The figure below shows multiple wells coming off several well pads that are installed in a pitchfork layout in order to effectively drain the shale reservoir of hydrocarbons. The distance between well laterals in the shale is typically between 600 to 1,000 feet depending on how far out the fractures propagate from a well, which may be 300-500 feet from the well dependent on the geology and fracturing techniques. Optimal well spacing is important as operators need to have an estimate of how far out fractures grow so they know how far apart to install wells in order to capture the hydrocarbons and not leave unfractured shale in between wells to maximize production from a given area, which in part determines the estimated ultimate recovery for wells.
Actual production varies from shale to shale and from well to well based on geologic factors. A good well in the Marcellus shale may initially produce 10 million cubic feet of gas per day (MMCFD) however some wells have initial production (IP) rates approaching 80 MMCFD! Shale wells can have extremely high production at first, however as the connected fractures are drained and gas desorbs from the from rock matrix the production can drop off dramatically, by 50% or more after a year of production. The ultimate recovery of gas from a shale formation may only represent 25-40% of the gas contained in the shale, this is because the methane molecules are adsorbed to the shale itself and may not want to let go anytime soon! However, shale gas wells are projected to produce for several decades and therefore a well with an IP of 10 MMCFD may have an estimated ultimate recovery of 10 billion cubic feet (BCF). A rough estimate is that approximately 50% of the gas in a shale well will be produced in the first 3-5 years and the remaining 50% of the gas will be produced over the next 25-30 years. The ultimate recovery of oil from a shale formation may only represent 10-15% of the oil contained in the shale since the oil is much more viscous than the methane and doesn't flow as readily through the low permeability formation. In the oil window of the Utica shale in Ohio some well's may produce over 1,000 BBLs of oil initially but, again the production may be much lower after a year. Many operators try to control the flow rate of oil and gas coming out of a well by "choking" the well, in essence governing the flow at a lower rate initially in hopes of maintaining higher reservoir pressure for a longer period of time and producing a larger volume of hydrocarbons over the course of time (slow and steady wins the race!).
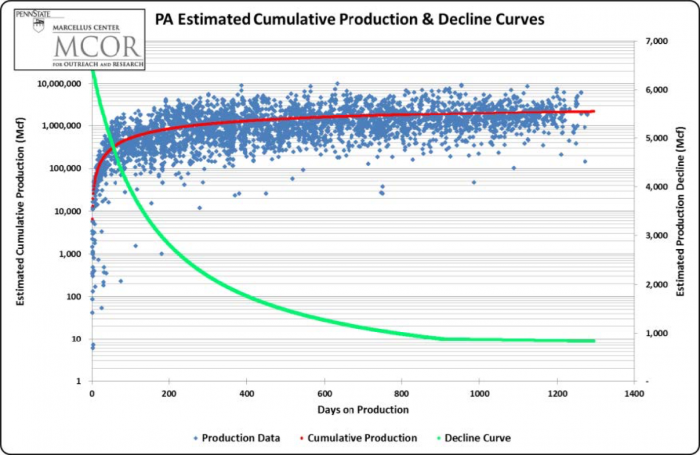
The figure below shows a generalized production decline curve for shale wells in the Marcellus and& the cumulative production from a well over the course of time. Again note that the initial production is highest, around 6.5 MMCFD, and then after about one year, the production is 2 MMCFD, a production decline of 66%. The good news is that the decline rate drops off with time and reaches a near equilibrium after several years and can continue for decades. If the well is paid off in the first few years of production then the lower production may be OK and fairly profitable for the company. The landowner who may be receiving royalties has to pay attention to the decline curve, because the first few months or years may result in really big royalty checks, which then decrease over time.
We will look more at production rates and how that relates to the utilization and economics of shale energy production in later lessons.