Water Quality and Human Health
The distribution of water-rich and water-poor regions is of course not the whole story – access to clean water isn’t just about the amount of water that falls as precipitation. It’s also about the infrastructure needed to obtain, treat, transport, and deliver potable water. And that’s just the water supply. Disposal and sanitation of dirty water are equally important and require a means of transporting waste away from the distributed sources, collecting it and treating it, and discharging it safely. Ideally, both supply and waste conveyance systems should also be monitored for performance and for their impacts on water quality.
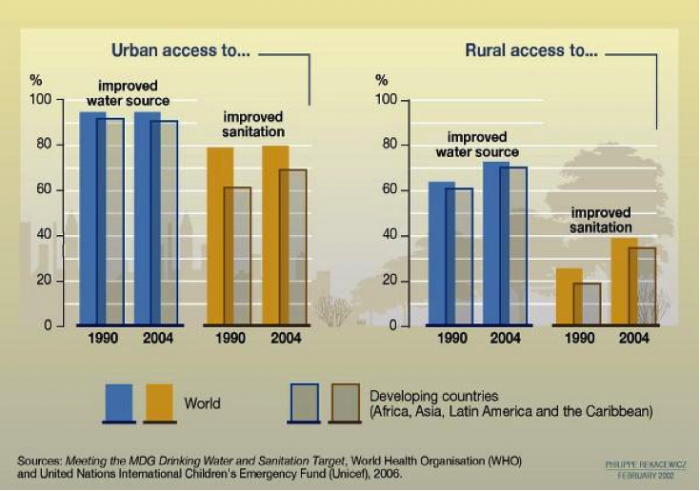
In some areas, water is plentiful, but access to clean water is not (Figures 7-8). The converse is also true, mainly in developed nations where water projects, desalination, or dams provide a water supply to regions that receive little precipitation. There is also a clear distinction between access to clean water in rural and urban areas (Figure 7), wherein access in rural areas, even in developed nations, lags behind that in urban areas.

Click the link to expand for a text description of Figure 7.8
| Year | Status | Water Supply | Improved Sanitation |
|---|---|---|---|
| 1990 | World | 95% | 79% |
| 1990 | Developing | 92% | 61% |
| 2004 | World | 96% | 80% |
| 2004 | Developing | 91% | 70% |
| Year | Status | Water Supply | Improved Sanitation |
|---|---|---|---|
| 1990 | World | 63% | 26% |
| 1990 | Developing | 61% | 19% |
| 2004 | World | 72% | 39% |
| 2004 | Developing | 70% | 35% |
Learning Checkpoint
1. What is the primary trend shown in Figure 7 above, with respect to urban vs. rural areas?
2. Is there a major difference in access to clean water supply and sanitation when comparing developed and developing nations?
3. Which is the bigger difference – urban vs. rural, or developed vs. developing nations?
4. Do you find your answer to question #3 surprising – or is it what you had expected?
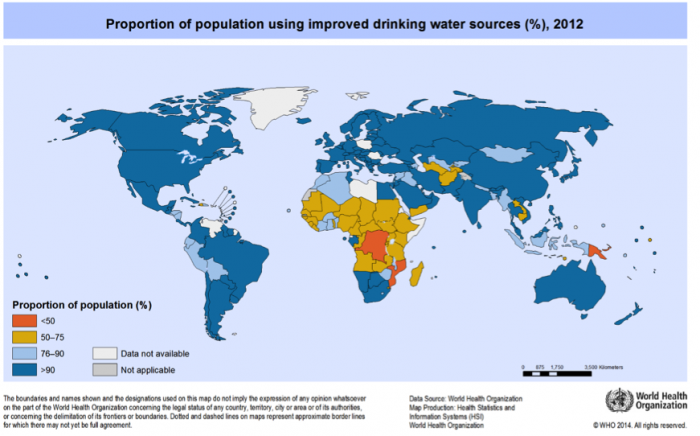
Access to clean water differs between rural and urban areas, and between developed and developing nations. In general, in rural areas, even in developed nations, access to water and sanitation lags behind that in urban areas. Globally, the areas with the poorest access to clean drinking water are in equatorial and sub-Saharan Africa, and parts of South America and southeast Asia (Figure 8).
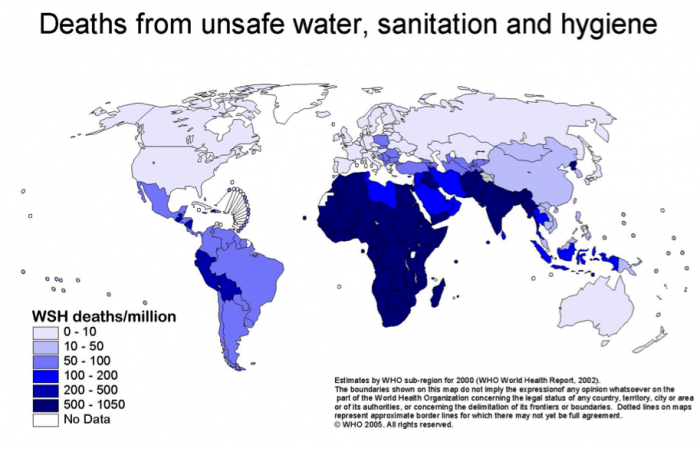
One might imagine that access to clean water and sanitation would be strongly correlated with water-related illnesses and death. For example, compare the maps in Figures 8 and 9.

Learning Checkpoint
1. Compare the maps in Figures 8 and 9. Is there a correlation between access to improved water and water-related illness? Note two areas where there is a correlation, either positive or negative. See Figures 8 and 9 above.
2. Based on Figure 8 and the distribution of water availability, do you think that these problems are related to water scarcity, or more related to water treatment and infrastructure?

