Hydrograph
A hydrograph is a graph of discharge over time. The time period shown could be short, for example, the flow resulting from an individual rain storm, or it could be long, for example, a continuous record of flow over many decades. While numerous federal and state agencies, corporations, and individuals monitor discharge in streams throughout the country, the US Geological Survey is the chief entity charged with monitoring streamflow, maintaining over 9,000 stream gages, most of which record water discharge in 15 minute intervals and many of which also include water quality data. Visit the USGS Water Resource webpage (water.usgs.gov) and peruse the wealth of information compiled to assess water resources. Exercises utilizing these data are included below in module 3 as well as module 4.
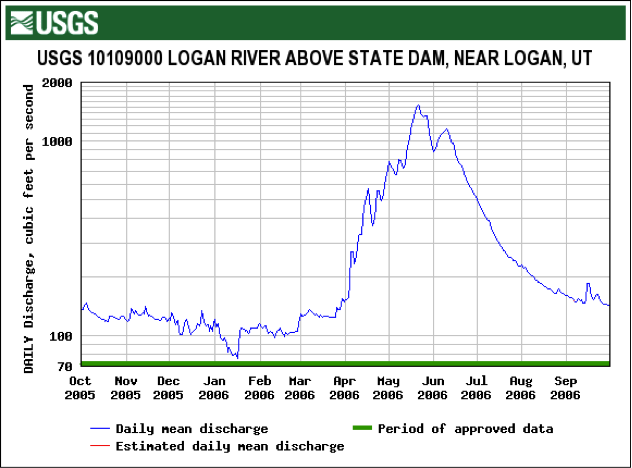
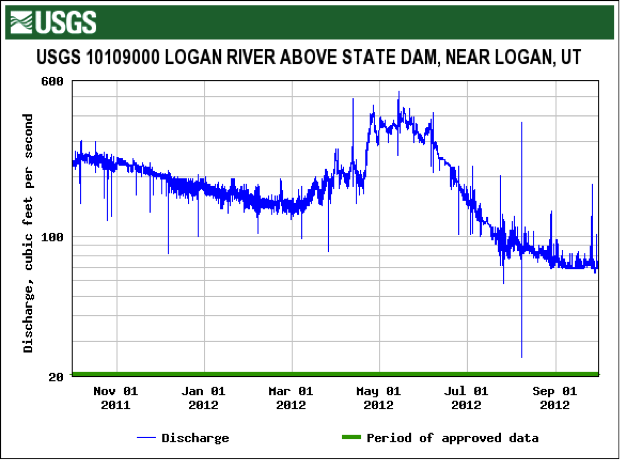
The Figure 4 shows example hydrographs from the Logan River, near Logan, Utah for two different water years (2006 and 2012). The water year begins October 1 and ends September 30. Hydrologists often prefer to conduct analyses based on the water year rather than the calendar year to facilitate comparison of incoming precipitation and outgoing streamflow, and specifically to ensure that snow delivered in October, November, or December is accounted for in the same time period that it is likely to melt, which may be in spring or summer of the following calendar year.
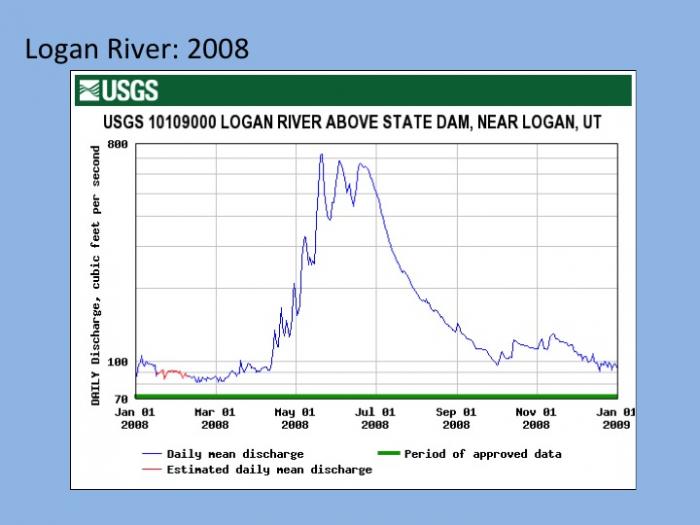
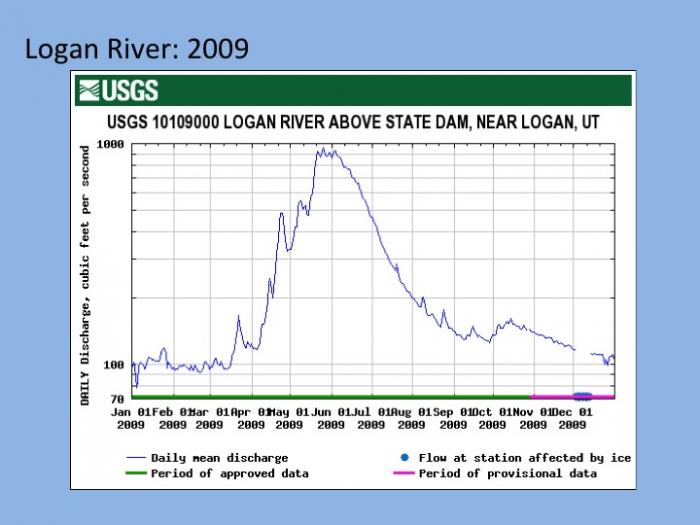
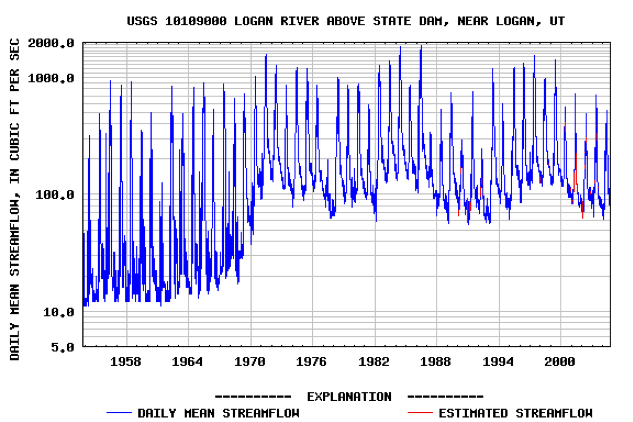
The Logan River hydrograph shows a long (about 5 month) prominent peak in discharge, primarily driven by snowmelt, with many other smaller peaks superimposed (from accelerated snowmelt during warm periods or rain events). The hydrograph of the Logan River over a 50 year time period (Figure 6) shows the prominent peak from snowmelt each year, but provides little information about the smaller scale variability that is visible on the annual timescale. Note the non-linear y-axis of the plots. Such axes can be useful for visualizing detail in both high and low flow conditions, whereas the detail in low flows would not be visible on (typical) linear axes. The apparent shift in low flows circa 1970 on the Logan River was caused by removal of a water diversion upstream from the gauge. Note that there is a considerable amount of ‘noise’ (i.e., variability) in streamflow over the past 50 years. This variability is not random, but rather has some ‘structure’ to it, some of which is visibly obvious (annual peaks) and other portions that can only be quantified using advanced analytical or statistical techniques, which are beyond the scope of this course, but currently represent a vibrant facet of hydrologic research.
Examples of Logan River Hydrographs 2008-2009