Hydrologic Variability Versus the Human Need for Water Resource Reliability
Floods and droughts are natural phenomena throughout the world and natural systems have adapted to this variability over time. But human demands for water resources are not so adaptable to variable hydrologic patterns. What if you could only turn on the tap during and immediately after rainfall events? Hydroelectric dams also require a constant supply of water to respond to electricity demands on timescales of minutes and hours. Farmers in drier areas require a reliable supply of water to keep crops watered and soils from drying out. In response to societal needs for a reliable and sufficient supply of water, we have developed an extensive infrastructure to even-out variability in natural flow regimes and therefore reduce uncertainty associated with both floods and droughts.
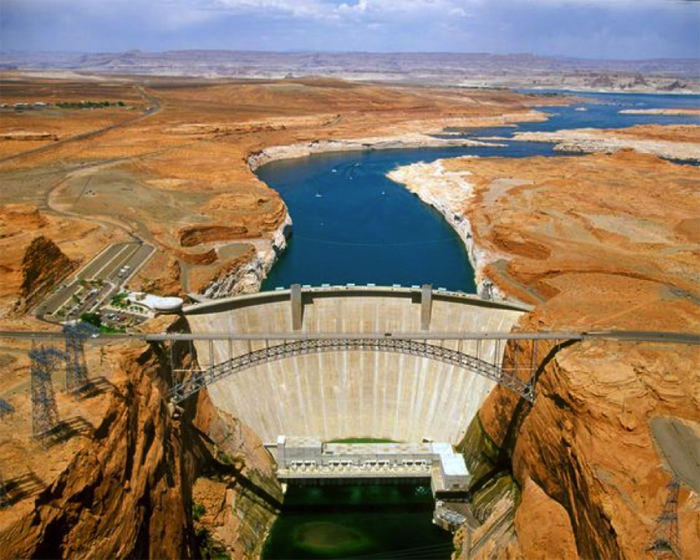
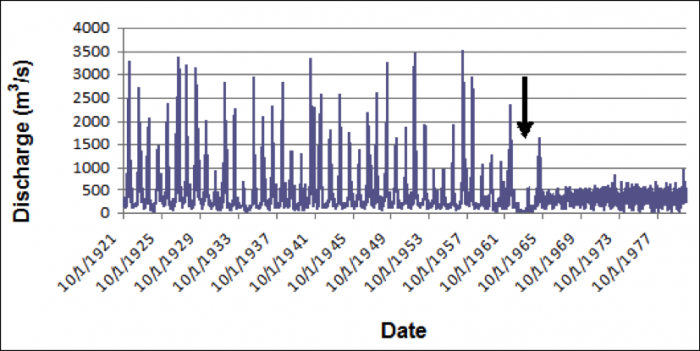
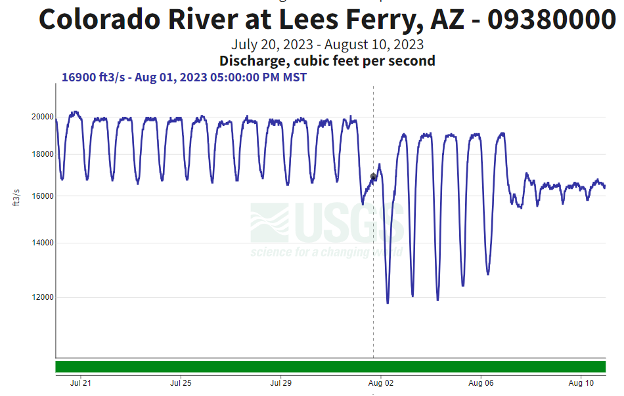
In particular, dams and reservoirs have been constructed around the world to store water during times of flood and provide water during times of drought – as discussed in detail in the next module (Module 5) (Figure 14). Over half of the world’s large river systems (those holding 60% of the world river discharge) are impacted by dams. In fact, the construction of dams and associated filling of reservoirs slows the rotation of the Earth (though only adding ~0.1 microseconds to the length of a day)! However, as we will see in Module 5, the construction of dams and evening out of hydrologic patterns has profound impacts on geomorphic and ecological processes in river systems, and the manipulation of discharge leads to reduced variability in flow regime (e.g., Figures 15 and 16), among many other effects.