
Droughts
Video: California's Extreme Drought, Explained (3:33)
This short video from the New York Times describes the economic and environmental impacts of the severe drought that occurred in California in 2014.
Narrator: Right now 100% of California faces severe drought. This is the San Luis Reservoir near Fresno.
Jennifer Morgan, Tour Guide: You're looking at the largest off-stream reservoir in the United States and it should be twice as full at this date and time. Normally you can see the water line where it's eroded on the hills and along the dam. And usually, we fill up every year except when there's a drought and this is the third year of a major drought.
Narrator: Here's what the reservoir looks like when it's full. Currently, it's only at half capacity. So far this year, California's had only 20% of its normal rainfall and the state's snowpack, another crucial water source, is only 18 percent. Here's a satellite picture of the state from January 2013. And this is from January of this year.
Greg Gustafson, Resident, Lake of the Woods, CA: How can you flush your toilets? How can you take a shower? How can you brush your teeth in the morning?
Narrator: The results of this historic drought are already being felt nationwide.
Bill Diedrich, Farmer, Fresno, CA: A grower like myself, fourth-generation, who has so much emotion and so much of his passion tied up in dirt and production and making things grow, this is a heartbreaker.
Narrator: California produces 90% of the nation's tomatoes, 95% of its broccoli, and 99% of its almonds. That's what Bill Dietrich farms here in Fresno County. For the first time ever, the state has stopped providing water to farmers in some areas.
Bill Diedrich: Our water allocation in this area is zero. Apparently, these trees haven't received any water at all this year.
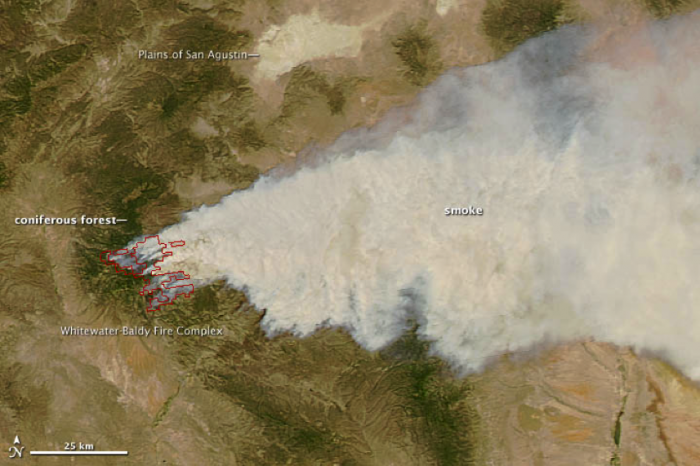
Narrator: California's agricultural output could fall by three and a half billion dollars this year. Costs across the nation are already up, attributed at least partly to the drought, with more increases expected down the line as crop yields come in this fall. The price for a single avocado could jump by 28 percent. The lack of water also means fire. California officials are bracing for a summer that could be the worst ever. A million acres could potentially burn, with costs that could surpass a billion dollars.
President Obama: Weather-related disasters, like droughts, wildfires, storms, floods, are potentially going to be costlier and they're going to be harsher.
Narrator: So how will California escape this cycle of drought? Governor Jerry Brown has called on Californians to lessen water usage by 20%.
Governor Jerry Brown, CA: And I'm calling for a collaborative effort to restrain our water use.
Narrator: But so far there's only been a five percent reduction. There are also much-needed infrastructure improvements. Converting seawater is one highly costly option. There's also the need to expand California's reservoir system, like the San Luis, for more backup during the dry spells.
Jennifer Morgan: It's going to be tough for everyone because of the drought.
Narrator: But for now drought may be the new norm across California.
California Resident: Instead of just using the dishwasher and wasting the water, might as well do it by hand and fill up the bucket and use it for the plants.
How do you know when you’re in a drought?
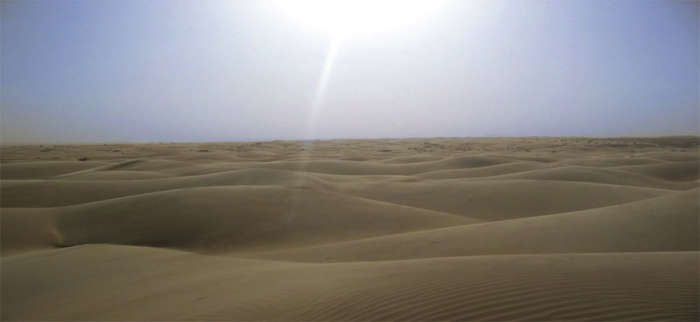
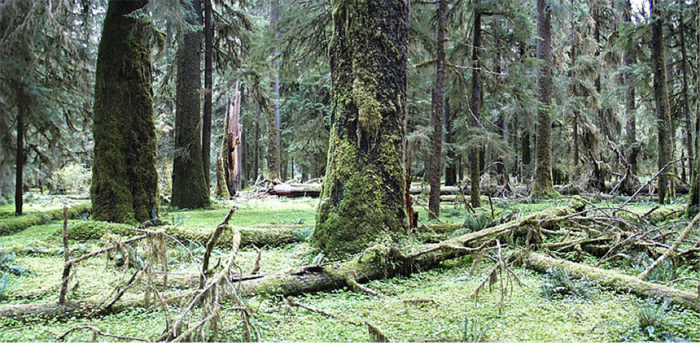
Identifying an area as ‘in drought’ is different from identifying it as ‘arid’. While the two may seem related, the subtle difference is important. Aridity is defined as the “degree to which a climate lacks effective, life-promoting moisture” (Glossary of Meteorology, American Meteorological Society). Drought, on the other hand, is ‘a prolonged period of abnormally dry conditions.’ Thus, aridity is a quasi-permanent condition (persistent over human timescales), while drought is a temporary condition (which may persist for weeks, years, or in some cases, decades). The Sahara Desert is an arid environment. The Hoh rainforest in western Washington State is a very humid place that occasionally experiences drought.
Droughts tend to be somewhat elusive phenomena, with severity gradually increasing over many days, weeks, months, or even years. The spatial extent of drought is also quite difficult to delineate, due to the spatial variability in precipitation. Therefore, they are much harder to define, monitor, and identify (relative to floods) within the ‘noisy’ background of natural wet and dry cycles. Yet the impacts of drought can be significant on many facets of the economy and environment. All types of drought originate from a deficiency of precipitation from an unusual weather pattern. If the weather pattern persists for a few to several weeks, it is said to be a short-term drought. However, if precipitation remains well below average for several months to years, the drought is considered to be a long-term drought.
Related to the difficulty in defining drought, economic damages related to drought are also difficult to define. But only considering economic damages that can be directly related to drought, it is clear that they too can be costly natural disasters. In 2013, EM-DAT claims only 9 deaths worldwide that were directly attributed to drought (15 is global annual average from 2003-2012), but a total of nearly 8 million people were significantly affected by drought in 2013 (average is over 36 million per year from 2003-2012). Damages related directly to drought in 2013 were estimated in excess of $1 billion (average of nearly $5 billion per year from 2003-2012). However, these numbers do not include related effects of wildfire and indirect effects of decreased food production, water quality, etc.
| Phenomenona and direction of trend | Likelihood that trend occurred in late 20th century (typically post 1960) | Likelihood of a human contribution to observed trendb | Likelihood of future trends based on projections for 21st century using SRES scenarios |
|---|---|---|---|
| Warmer and fewer cold days and nights over most land areas | Very likelyc | Likelyd | Virtually certaind |
| Warmer and more frequent hot days and nights over most land areas | Very likelye | Likely (nights)d | Virtually certaind |
| Warm spells/heat waves. Frequency increases over most land areas | Likely | More likely than notf | Very likely |
| Heavy precipitation events. Frequency (or portion of total rainfall from heavy falls) increases over most areas | Likely | More likely then notf | Very likely |
| Area affected by drought increases | Likely in many regions since 1970s | More likely than not | Likely |
| Intense tropical cyclone activity increases | Likely in some regions since 1970 | More likely than notf | Likely |
| Increased incidence of extreme high sea level (excludes tsunamisg | Likely | More likely than notf,h | Likelyi |
Table notes:
a See table 3.7 for further details regarding definitions.
b See table TS.4, Box TS.5 and table 9.4.
c Decreased frequency of cold days and nights (coldest 10%).
d Warming of the most extreme days and nights of each year.
e Increased frequency of hot days and nights (hottest 10%).
f Magnitude of anthropogenic contributions not assessed. Attribution for these phenomena based on expert judgment rather than formal attribution studies.
g Extreme high sea level depends on average sea level and on regional weather systems. It is defined here as the highest 1% of hourly values of observed sea level at a station for a given reference period.
h Changes in observed extreme high sea level closely follow the changes in average sea level. {5.5} It is very likely that anthropogenic activity contributed to a rise in average sea level. {9.5}
i In all scenarios, the projected global average sea level at 2100 is higher than in the reference period. {10.6} The effect of changes in regional weather systems on sea level extremes has not been assessed.
There are four different kinds of drought.
- Meteorological drought refers to a deficit in precipitation that is unusually extreme and prolonged. By definition, meteorological drought must be identified relative to the typical precipitation regime of an area and could be defined as some point out on the long-tail of the distribution of, for example, a plot (histogram or probability density function) similar to Figure 4, except with the x-axis indicating the number of consecutive dry days.
- Agricultural drought refers to a deficit in soil moisture that affects plant growth and productivity. While this term is most often used to refer to effects on agricultural crops, all plants can be affected by soil moisture drought. Paleoclimatologists (scientists who study past climate) examine the thickness of tree rings in woody plants to estimate the timing, duration, and severity of past droughts because water-stressed trees form relatively narrow rings in drought conditions.
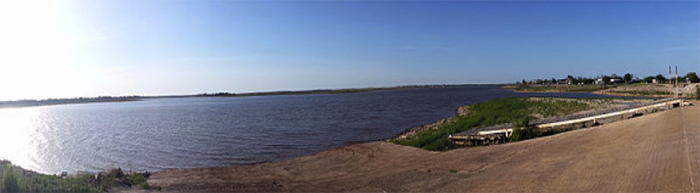
- Hydrological drought refers to conditions in which stream discharge and/or lake, wetland and water-table elevations decline to unusually low levels.
- Socio-economic or operational drought refers to conditions when water supply is significantly below demand such that water/reservoir management must be altered. Typically, when meteorological drought occurs, the effects cascade sequentially to the other three types of drought. Likewise, when the meteorological drought ends, the effects cascade in the same sequence, first restoring soil moisture, then restoring other hydrological ‘stocks’ within the system, and hopefully restoring the balance between water supply and demand at key water management infrastructure (i.e., reservoirs).
Activate Your Learning
Go to the US Drought Monitor webpage and answer the following questions:
1. Is the place where you live currently in a drought?
2. Looking back through historical maps, when was the last time your home town was in a drought?
ANSWER: The answer to this question will be different for everyone. Write your answers down and be prepared to talk about it with the class if it comes up.