Rupture characteristics of slow slip events
- They slip faster than the plate speed but slower than an earthquake. Millimeters per week is a good ballpark estimate of the speed.
- The ones measured so far slip as much as a large-magnitude earthquake but take a lot longer to accomplish that slip. That's why they are called "slow slip events."
- They are not detectable by seismometers due to the long rise time and slow rupture velocity. We use Global Positioning System data to measure them.
For example, the rise time for an earthquake is often negligible compared to the rupture duration, but for a slow slip event, the rise time can be a significant fraction of the overall time of rupture.

Rise time? What's rise time?
The rise time is how long it takes an earthquake to go from zero to its seismic rupture velocity. Generally speaking, earthquake rise times are fast compared to how long the earthquake lasts. Another interesting thing about earthquake rise times is that they are about the same regardless of the final size of the earthquake. The rise time of a magnitude 5 and a magnitude 8 are about the same. The difference is that a magnitude 8 lasts longer and a bigger chunk of ground is involved in the earthquake. For a slow slip event, the rise times are incredibly long and the event never does get up to a seismic speed at all. Since the motion is all so smooth and slow, seismic waves aren't generated. That's why we have to use GPS instead of seismometers to measure slow slip events. See my screencast for a sketch explaining rise time. Click here for a close-captioned version of the rise-time sketch.
Where have slow slip events been found?
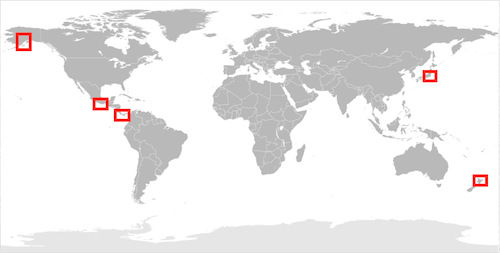
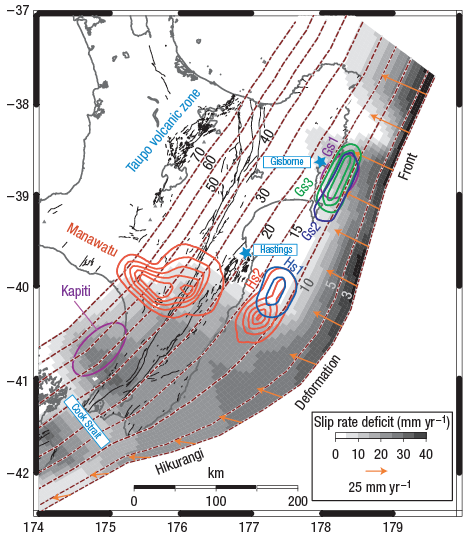
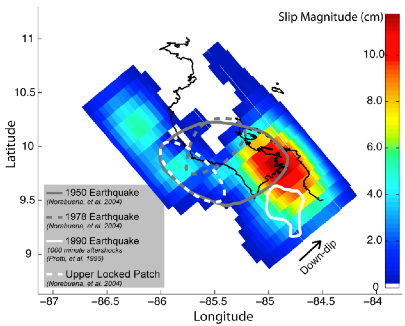
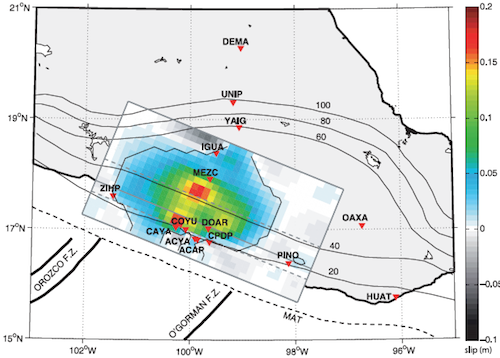
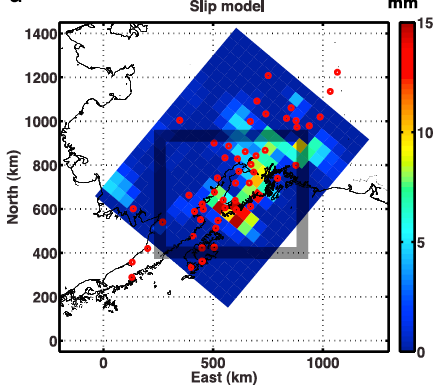
The figures below are reproduced from published papers that describe slow slip events detected in New Zealand, Nicaragua, Mexico, and Alaska. Their locations in the grand scheme of the world are shown with rectangles on the world map above, except Japan is missing from the detailed maps below. All the slow slip events shown here have two main things in common:
- Long duration compared to an earthquake (days to months instead of seconds to minutes), and
- Cumulative slip equivalent to 6.9-7.5 moment magnitude.