Cool things happen at subduction zones. In Lesson 6 we explored volcanoes that happen at these plate boundaries. Now let's explore how those plate boundaries move mechanically to generate earthquakes, and a relatively newly discovered phenomenon called "slow slip." First of all, let's remember what a subduction zone looks like, and what kinds of instruments we use to figure out what it's up to.
Quiz Yourself Review!
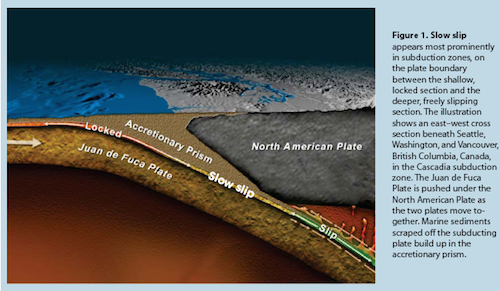
Let's review some things from Lesson 6 by looking at the drawing of the Cascadia subduction zone above.
Where are the Cascade Range volcanoes on the upper plate? Where does that correspond to on the lower plate? What kind of volcanoes are they? What kind of melting produces these volcanoes and how is it depicted in the cartoon?
Think about it and then watch my explanation as a screencast. You can also read a transcript of my quick Lesson 6 review.
Subduction zone mechanics: standard textbook vs. what we know now
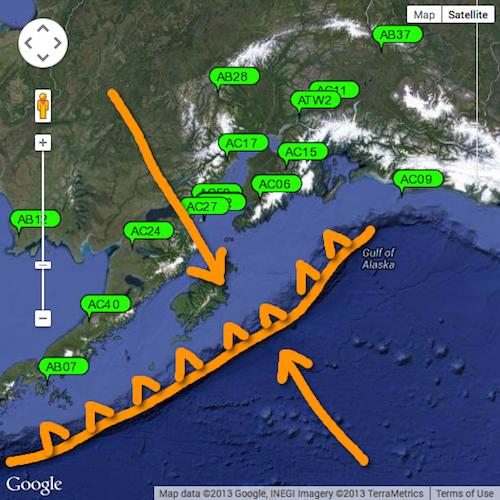
Below is a “textbook” depiction of a subduction zone and associated plate movement. This is a map of southern Alaska. In an introductory class or typical textbook, we’d probably draw arrows right on the plate boundary (trench) showing the two plates converging, like I did in this map. The teeth are on the upper plate. The Pacific Plate is heading northwest and diving under Alaska. The green bubbles are GPS station locations. The orange arrows show the direction of motion of the two converging plates.
Geodetic data from instruments near plate boundaries tell us that the image above is an oversimplification. In a subduction zone capable of sustaining great earthquakes, the upper plate and lower plate are locked together for some distance inboard of the trench. Therefore GPS stations on the upper plate near the plate boundary will record motion consistent with the direction of the lower plate. In fact, geodetic data can be used to infer the location of the locked section (see figure below).
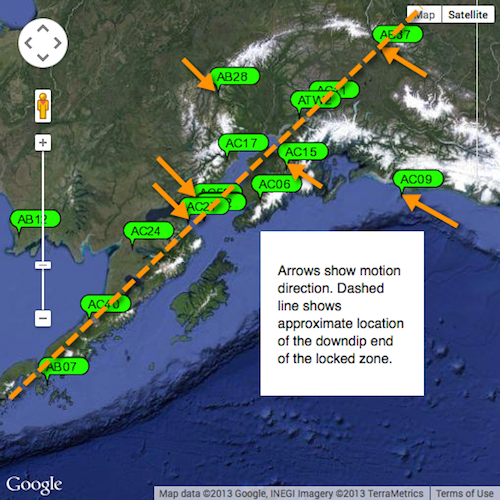
The point here is to see, via GPS, how the portion of the upper plate directly on top of the locked zone is dragged along in the direction of subduction because the plates are locked together. Green bubbles point to PBO stations. GPS stations on top of the locked zone show motion in the direction of the lower plate (northwest). GPS stations on top of the freely slipping zone show movement in the direction of the upper plate (southeast). We can infer where the locked zone ends by knowing the angle of subduction and by looking to see where the GPS stations record direction of motion consistent with the upper plate’s macro-motion.
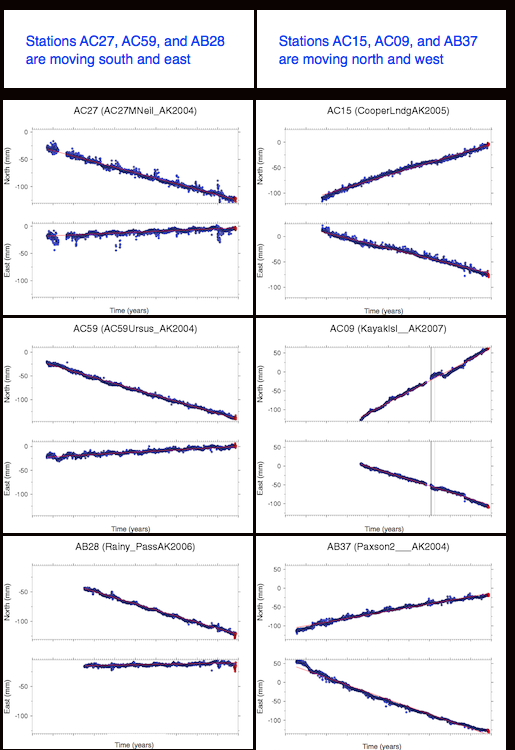
The GPS time series plots show motion south and east for stations AC27, AC59, and AB28. Those three stations are all far enough inboard on the upper plate that they are not over the locked zone. The GPS time series plots show motion north and west for stations AC15, AC09, and AB37. Those three stations are closer to the plate boundary and are over the locked zone. They are moving in the direction of the lower plate.
What does an earthquake look like in a GPS time series?
A GPS station normally records its position once per day. An earthquake only takes seconds to minutes to happen so a GPS station doesn't record all the details, like the arrival of P waves and S waves and things like that. It only records its own position. If the earthquake is big enough and nearby enough, GPS will show a sudden jump in the direction of earthquake slip. Let's check that out with an example.
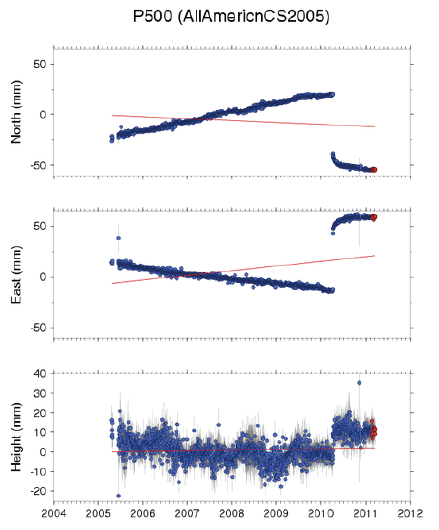
This is a station near the border of Baja CA and the US. It shows background plate motion to the northwest, then a sudden jump to the southeast. Sudden big jumps in geodetic data (that are not data dropouts!) are earthquakes. Most geodetic data is recorded daily but earthquakes take way less than a day to slip, so there is a sudden gap on the y axis. (A gap in x denotes a data dropout due to an equipment problem or something like that)
Slow Slip Events
For a long time we were all pretty happy with the idea that the life of a subduction zone involved a cycle of building up stress and having an earthquake that released the stress, then starting over again. But it turns out there's more going on.
Slow slip events have only been discovered in the last 10 or 15 years! They occur between the locked section and the freely slipping section of a subduction zone. Some people refer to the “locked section” as the seismogenic zone. If you are going to have a great subduction zone earthquake, such as Alaska 1964, or Chile 1960, or Tohoku-Oki 2011, this is the zone where it initiates and ruptures. The freely slipping section is the part of the downgoing plate that is too deep to be touching the other plate. It's the part that is hanging down into the mantle. In most subduction zones there is a region between the locked and the freely slipping parts, and that is where slow slip happens. It is usually at about 30-70 km depth.
Slow slip events do not generate seismic waves, so seismometers do not record them. GPS stations can, though! What does one look like? Let's check that out.
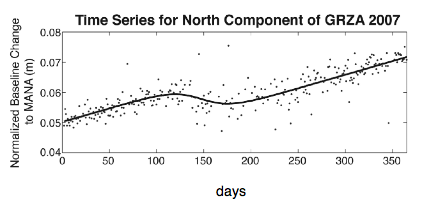
This figure was modified from Outerbridge et al., 2010 and depicts GPS time series data that was recorded in Costa Rica in 2007. It shows a slow slip event that took place between about day 125 and day 175 on this plot. Why do we call this a slow slip event? It is too fast to be the usual plate rate, and it is also in the opposite direction. It is way too slow for an earthquake because remember in the earlier GPS time series from Baja that an earthquake basically looks like a sudden jump that happens all at once, not something that takes 50 days to happen.
Check that you can read this plot!
What is the background plate direction and rate? What is the duration, direction, and rate of the SSE? Try it yourself and then click below to see my answers:
My answers to the posed questions.
The background plate rate (eyeballing here) looks like about 0.01 m per 100 days to the north, which is equivalent to 3.7 cm/year. That's a reasonable ballpark number. Note that we are only looking at the north component here so we can't say anything about whether it's east/west or up/down. The SSE begins around day 125 and lasts about 50 days. During that time this station moved about .005m south. From about day 175 until the end of 2007, this station was back to its usual plate rate.
Quick quiz to check yourself
An SSE involves slip in the same direction an earthquake would move, or in the same direction as background plate rate? Or are those two directions the same?
Answer to the quick quiz
An SSE involves slip in the same direction an earthquake would move, which is opposite the ordinary direction of this station because this station is on the part of the upper plate locked to downgoing plate. One way to remember this is that GPS stations are land-based. Land is always on the upper plate side of a subduction zone. So, GPS stations at subduction zones are measuring the position of stations on the upper plate. Stations over the locked zone will show you the sense of motion of the lower zone. Stations farther away from the plate boundary in the interior of the upper plate record the motion of the upper plate. Mechanically, the upper plate over top of the locked zone is getting scrunched during interseismic periods. During an earthquake it suddenly unscrunches. A slow slip event is a really slow unscrunching that seismometers can't hear.