Heat redistribution
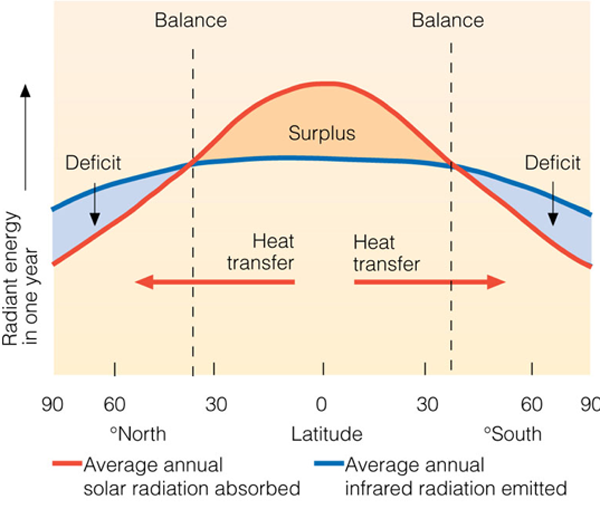
Earth's heat budget exhibits important variations with latitude. Heat input via solar radiation varies systematically with sun angle, and thus when averaged over a year, we find a simple relationship between latitude and heat absorbed, with more heat received in the equitorial region than in polar regions. The figure below shows this variation along with average annual radiation output from Earth. The dashed lines show the points at which input (heat absorbed at Earth's surface) is equal to output (heat lost via long-wavelength radiation).
Here's a useful animation for thinking about sun-angle variations throughout the year.
Now have a look at the figure below. This figure has important implications for wind generation and ocean currents because both are driven by temperature differences, and by heat input between the equatorial and polar regions. Winds and ocean currents play a major role in moving the surplus heat from the equatorial regions to the polar regions. Without this heat transfer, the polar regions of Earth would get colder every year and regions between ~ 35 N and 35 S would get warmer every year. Energy transfer occurs via sensible heat and via latent heat. As you'll recall from Lesson 3, latent heat of evaporation for water is very large compared to heat capacity, so it is no surprise that latent heat is the dominant process, with sensible heat transfer accounting for only a few percent of the heat flux, from ocean to atmosphere, associated with latent heat.
Wind and ocean currents
Winds and ocean currents play a big role in redistributing heat.
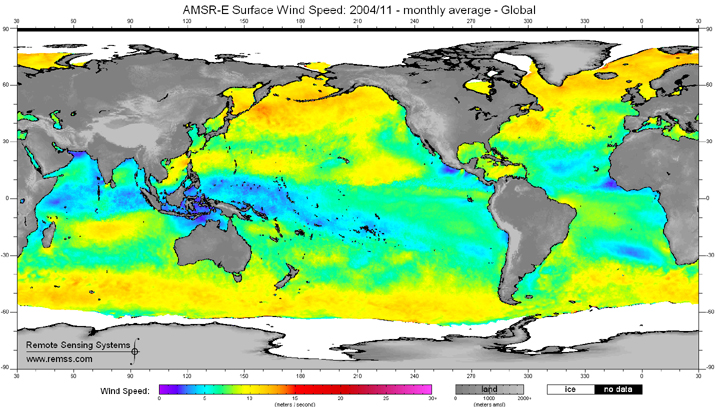
This figure shows sea surface wind speed, as derived from a NASA's satellite (Aqua) for the month of November, 2004. The large-scale pattern of surface ocean currents is set up by winds. Note the variations with latitude. Look back at the Hadley circulation and think about the location of the easterlies/westerlies compared to what you see here.
Reading assignment
Read the link below.
- The Atlantic heat conveyor slows Are we heading toward The Day After Tomorrow?