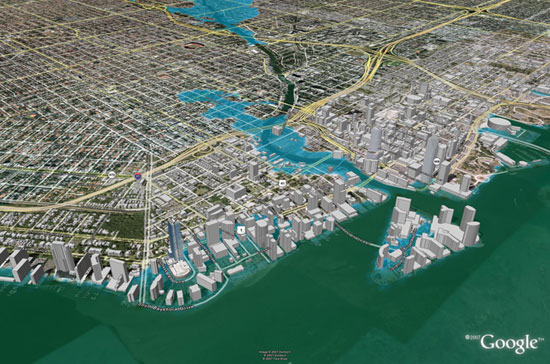
Figure 1: Here is an image for downtown Miami, FL, showing the effects of a 1.25 meter rise in sea level above mean high water.In high water. You can make your own images like this for your favorite area (later activity).
Images like this are available for a set list of cities from architecture2030.org.
Fig. 2: This is a plot of changes in mean sea level (in millimeters) for 1993 through 2006 using satellite altimetry data. The data suggest that sea level has risen at a rate of ca. 3 mm/y over this period. Note the smoothing and removal of "seasonal signals." Also, keep in mind that this is "mean" sea level (globally averaged). There are differences in response around the world ocean (see Fig. 3 below).
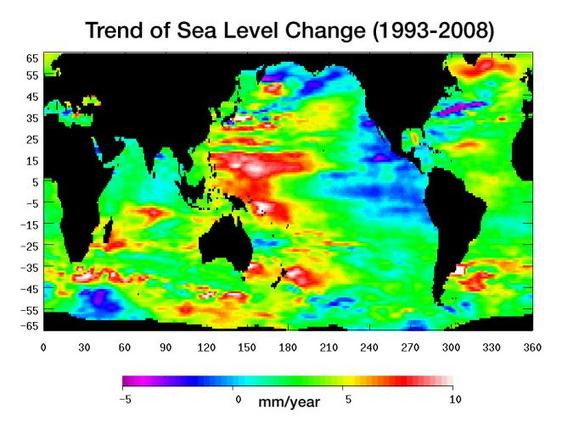
Figure 3: This map for 1993-2008 shows the average rates of change in sea level for small blocks of the ocean on the basis of satellite altimetry data. This illustrates the wide variation in rate and direction of sea level change globally. Much of the ocean is in the "green" zone, hovering near the globally average rate of 3 mm/y. But what about those anomalies?
Activity 1
After reading the assigned articles and examining the figures above, answer the following questions. You may simply provide a list of elements, when appropriate. Elaborate if you like.
- How much sea level rise has occurred since about 18 thousand years ago and why (generally)?
- How do geologists estimate sea level history, at least for the last glacial through the Holocene (last 18 thousand years)?
- What methods are used to estimate rates of change of sea level at present and in the historical past? Provide an estimate of their accuracy.
- What are the major components of present sea level rise and their relative importance?
- In Figure 2 (above), why is there so much noise about the smoothed curve?
- In Figure 3, why do certain anomalies occur (explain in terms of circulation, winds, etc.--use principles from Lesson 4)?
- explain the large area of red to white color in the western Pacific on each side of the Equator
- explain the large area of light blue to dark blue in the eastern Pacific straddling the Equator
- speculate about the origin of the swath of blue to magenta projecting to the northeast from the margin of the eastern U.S.
- What is the "best" estimate as to the amount of sea level rise that will occur in the next half century? Why did you choose this number? What assumptions are you making when you state a number such as this? Provide an estimate of uncertainty based on the assumptions. Do you believe that this will come to pass?
- Think about the IPCC Report that you read. It represents a "scientific consensus." What does "consensus" mean in this regard? Do you view this term as controversial? Just because the "majority" of scientists accept this concept of global warming and sea level change, should we base our present and future actions on this hypothesis? Why or why not?
Submitting your work
Please put your answers in a file and drop that in the dropbox on Canvas.
Save your document as either a Microsoft Word or PDF file in the following format:
L5_Activity1_AccessAccountID_LastName.doc (or .pages or .pdf)
For example, student Elvis Aaron Presley's file would be named "L5_Activity1_eap1_presley.doc".
Grading criteria
See the grading rubric for specifics on how this assignment will be graded.