Let's evaluate some of the data sets required to establish the history of sea level changes. This history can provide a perspective on more recent rates of change. Inasmuch as it is our goal to encourage you and your students to critically evaluate scientific hypotheses and data, this is another in a series of issues that deserves deeper study. In particular, this is an opportunity to see how the media respond to various issues and how individuals might distort conclusions of scientific papers, or selectively extract certain data or plots, to further their own objectives. It will not surprise you to find that there are skeptics regarding the predictions of the IPCC Report and others. We will examine some of them and attempt to analyze their methods and misstatements or misleading conclusions. You can have some fun with this and perhaps think about how it would tie in with teaching goals.
Reading
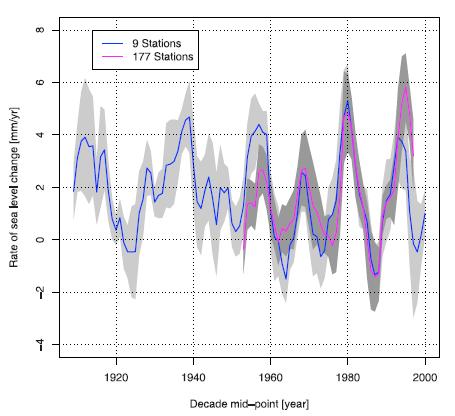
This is the scientific paper published in 2007 by S.J. Holgate, a reputable scientist studying sea level changes at the Proudman Oceanographic Laboratory, Liverpool, UK (wonder if he listens to "Yellow Submarine" when he writes his papers?). The paper is a critical evaluation of tide gauge data used in reconstructing sea level history. You will need to read this paper to understand how tide gauges are used and their strengths and weaknesses. The paper also emphasizes spatial statistics, which are an important consideration in global reconstructions.