
We often want to perform calculations concerning total utility in a market, or total costs, or some such thing, and to do this, it is helpful to define the functional relationships on a supply and demand diagram with a mathematical equation.
So, an example of a demand curve may be specified as follows (Please note that P stands for "Price," and Q stands for "Quantity") :
This describes a downward sloping line, which intersects the y-axis (which represents price in a supply-demand diagram) at a value of 100, and declines in value by 2 for each extra unit we travel along the x-axis (which represents quantity of goods sold in a supply-demand diagram).
So, if the Quantity is 20, we would say , , and so on.
If you look at the market demand curve for pizza, on the previous page, we might want to describe it as P = 9 - 0.5Q, which describes a straight line with a y-intercept of 9 and a slope of -0.5. In that case, for example, market price for pizza when the quantity is 10 will be: .
Example:
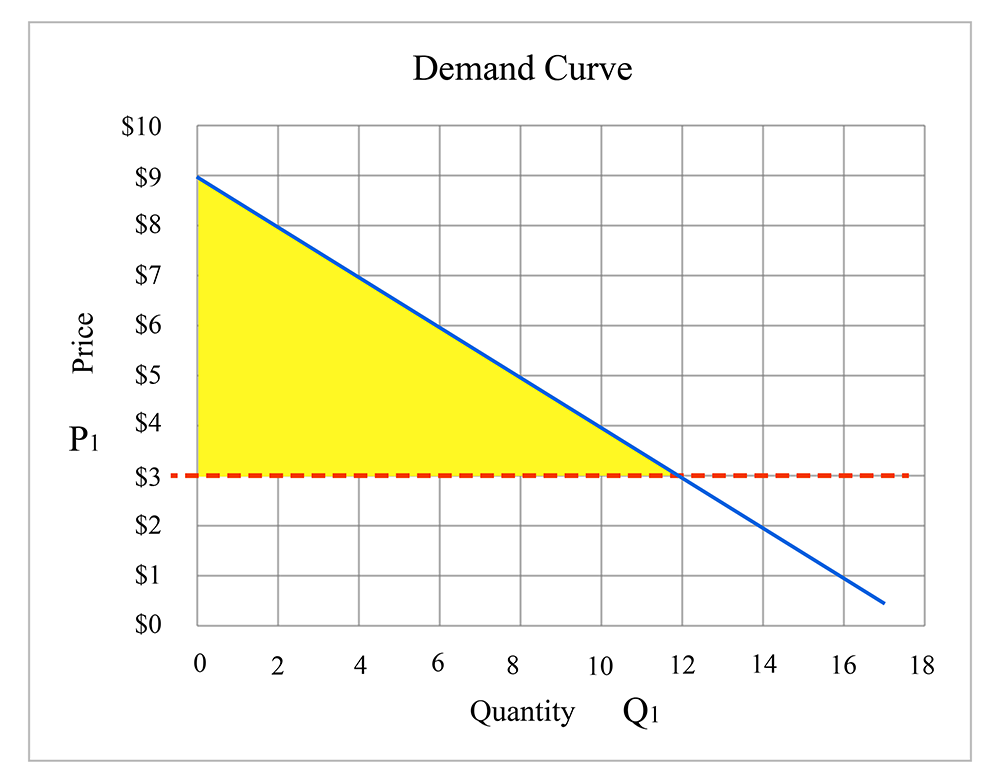
Assume the market demand curve for pizza is . Calculate the consumer surplus if the price of pizza equals $3. Try to use two methods to calculate the consumers surplus:
- Mathematical equation
- Geometry: and calculating the area of the triangle
Then compare your answers. You should have the same answer.
Answer:
We need to calculate the area of the triangle. First, we need to find the coordinates of three corners of the triangle between demand curve and price. Then we have to find the length of the sides.
The coordinate of the three corners are:
Top corner: (0,9)
Bottom left: (0,3)
Bottom right: to find this point, we need to plug the price = 3 into the demand equation and find the Q. . And Q will be 12. So, the coordinate of the bottom right corner will be (12,3)
Knowing these three points, we should be able to calculate the area of the triangle as:
Geometry:
We need to draw the graph and calculate the area of the triangle ( ):
The market demand curve could be a more complicated function. This illustrates what I have mentioned before: real life is a very complicated thing to model, but in economics, we can use simple models to describe and explain human behavior and market outcomes. So assuming a linear demand curve may be a simplification of reality, but it aids our understanding of markets, and if we can perform numerical examples, it makes the illustration of concepts easier for a lot of us.
Practice Exercise
Calculate the the consumers surplus for P = 60 when demand function is P = 90 − 6Q.
P1 = 60
60 = 90 - 6Q then Q1 = (90 - 60)/6 = 5
CS = (90 - 60)*5/2 = 75