As with trend analysis and market indicators, there are several types of price signals. We will deal with a few of the ones that are more common and easy to use.
Support & Resistance
As prices move up and down, traders make decisions as to when to continue to buy in an uptrend and when to sell in a downtrend; that is, they try to determine when the current trend will exhaust itself and change direction. One way to do this is to look at the “support” and “resistance” price levels. Support represents a price level at which buyers will step back into the market after a period of selling. This interest establishes a “floor” price. Traders find value at this level and start to buy-up the contracts again. In some cases, traders who have been selling contracts during the downtrend may be buying them back to take some profits. Resistance is the price level at which the market is no longer interested in buying contracts. The price is deemed to be too high and sellers re-enter the market, thus establishing a "ceiling" price.
So, how do we establish these pricing points? As the chart below (shifted to the right) shows, when we draw upper and lower trend lines, the lines continue through price points on the right, vertical axis. Where the upper trend line crosses the right axis is the resistance point, while the price where the lower trend line crosses the right axis is the support point. Theoretically, then, these represent both the maximum the market is willing to pay as well as the minimum at which it is willing to sell.
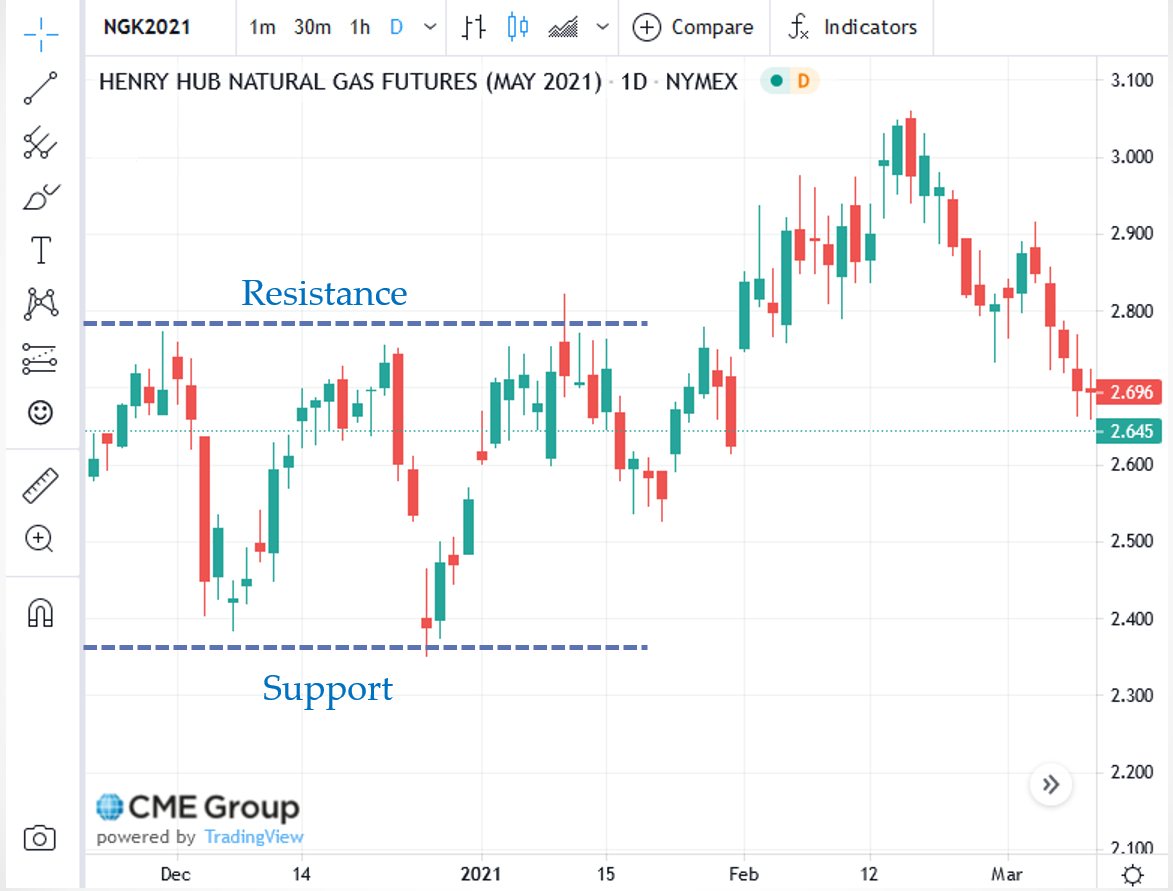
This chart indicates that resistance and support. Traders will now look to see if prices can trade above, or below, these levels. If they do, there will be a flurry of activity in the direction of the move.
Tops & Bottoms
Since we are on the subject of support and resistance, we can discuss price signals related to those concepts. As we have said, traders are interested solely in price movement. And support and resistance levels represent buying and selling interest. So, what happens when the buyers or sellers step in to halt the moves higher or lower? They are testing the points of support and resistance. If the sellers can’t break through support, it is a result of buyers stepping in. As mentioned above, that sets a “floor” or “bottom” price on that day. Likewise, if buyers test the resistance price and sellers step in to prevent a breach of that level, a “ceiling” or “top” is established.
While a one-day occurrence of these events is not a very strong indicator of a change in direction, the more a “bottom” or “top” is tested and holds, the more significant that price level becomes. Think about it this way. Let’s say natural gas Traders are trying to sell May contracts and push the price down to the $2.37 Support level on the chart above. Buyers step in at that price and the sell-off fails. The next day, Sellers again attempt to push prices down to $2.37, and again, the move fails.
Let's assume the market now begins to see $2.37 as a stronger Support price. We refer to this as a “double-bottom.” While this is still a good indicator of price levels, a third day, or “triple-bottom” is a strong indicator that prices could rally higher. Traders have no choice but to recognize the buying interest at $2.37 and thus will buy contracts until the Resistance, or “top” is tested. The same holds true for resistance levels, but in reverse. The more “tops” are established, the stronger the level at which sellers will step in and sell contracts.
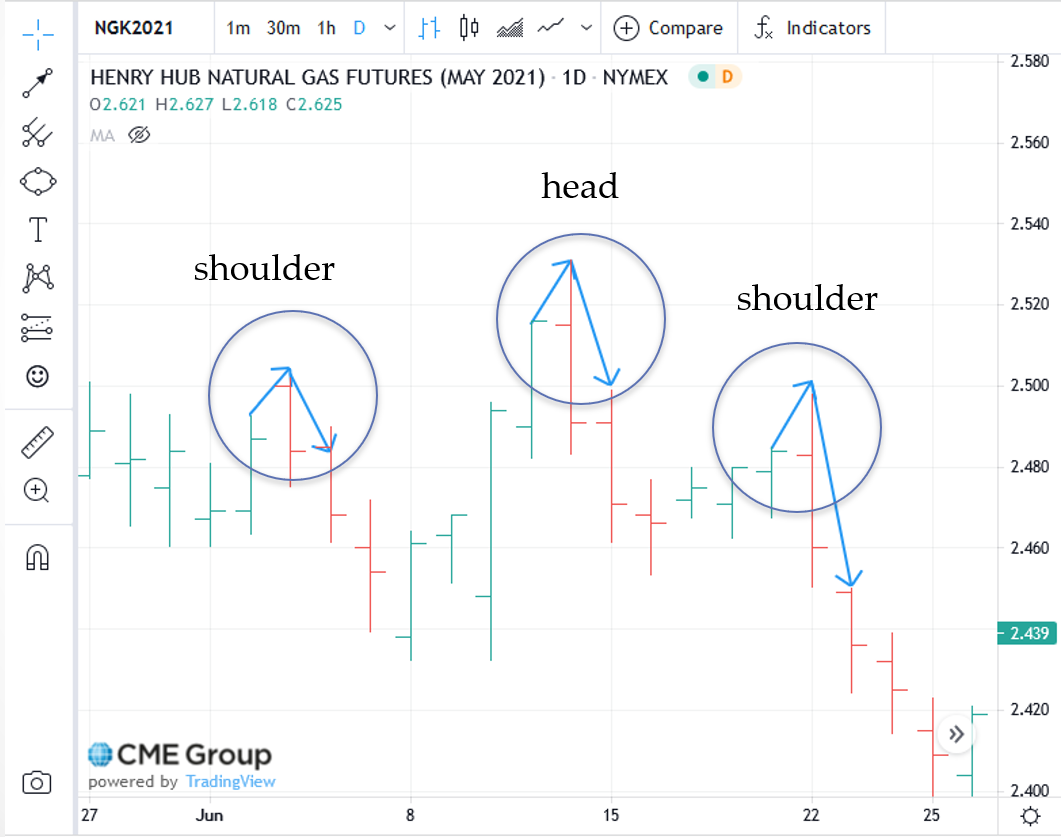
"Head-and-Shoulders" Reversal Patterns
Head and shoulder reversal patterns are identifiable, price patterns that signal a change in direction and can be used for long-term or short-term trend analysis. This consists of three trading days where the middle day’s High, or Low, is higher or lower than that of the other two days. The first day then represents the “left shoulder,” the second day is the “head,” and the third day is the “right shoulder.” Using the chart below without all the trend lines, we can see that on June 14th, the High for the day was higher than the 3rd. We are now looking for the completion of the pattern, the right shoulder. And on June 22nd, the High for the day was lower than the head. Now you can see the pattern whereby the 3rd is the “right shoulder,” the 14th is the “head,” and the 22nd is the “right shoulder.” The right shoulder “leans” in the direction of the price change. In this case, prices reversed from an uptrend to a downtrend. There are also “reverse” head-and-shoulders patterns. These occur in an upside-down fashion and signal a move from a downtrend to an uptrend.
"Consolidation” Patterns
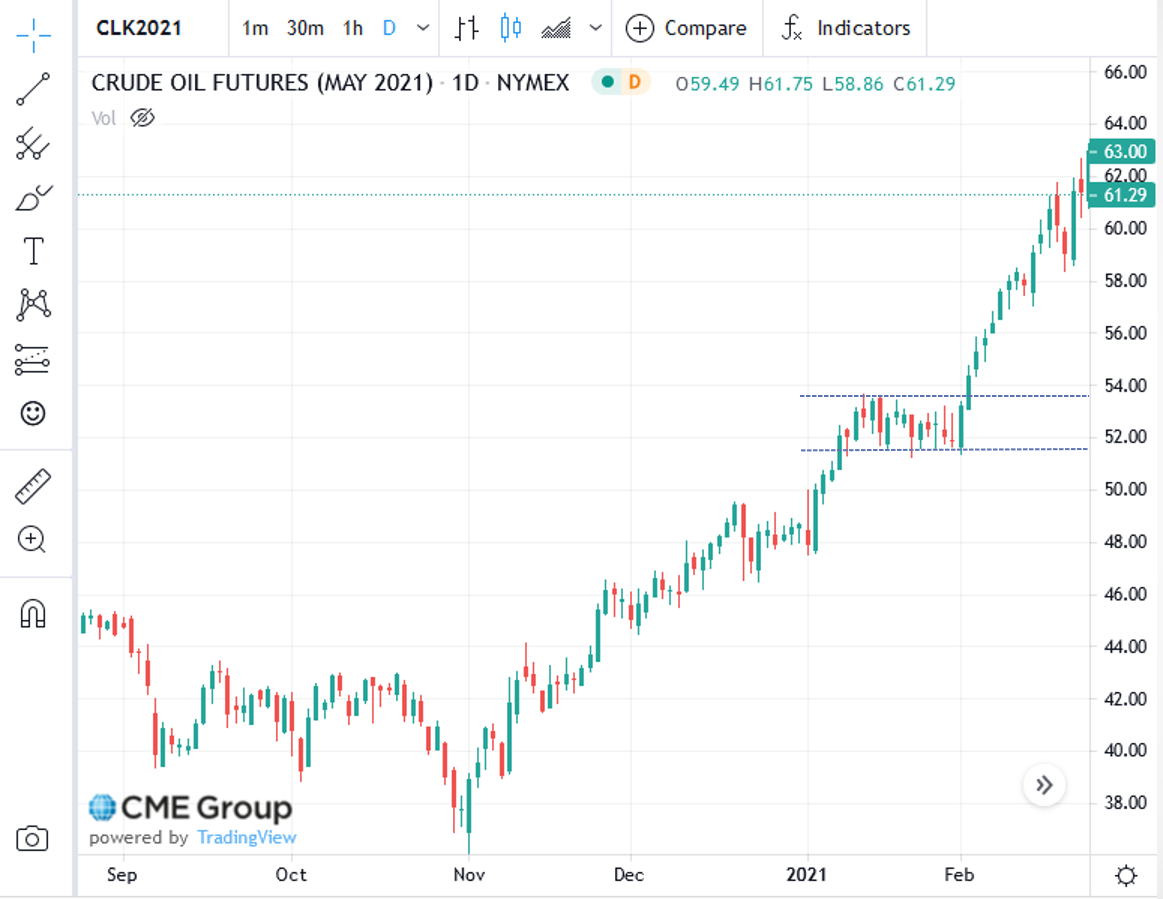
When upper and lower trend lines are drawn and are parallel to one another and perpendicular to the Y-axis, they form a rectangular shape. The upper trendline does represent resistance, with the lower trend line indicating support. In this pattern, prices will move up-and-down within the rectangle. This “consolidation” is indicative of market indecision. Traders are not really sure what direction prices should take. It is a battle between buyers and sellers. The key here is the number of days this pattern continues to exist. The longer traders battle, the more momentum builds-up for when prices break-out of this range. Think of it as a spring that winds tighter and tighter for each day prices stay within the consolidation range. That means a very large price movement will occur in the direction of the breakout. A good illustration of this is the May 2021 crude oil contract, shown below. Starting in January, the contract bounded by a Low of about $52 for twenty-four straight days. The High was about $54 with the exception of attempted "break-outs". On February 2nd, prices broke-out to the upside with good momentum.
These are but a few of the methods in Technical Analysis used to try to determine when a greater probability exists of prices moving in one direction vs. another. Once determined, traders enter or exit the market at those price levels.