
Introduction
The Energy Information Administration glossary defines renewable energy sources as "energy resources that are naturally replenishing but flow-limited. They are virtually inexhaustible in duration but limited in the amount of energy that is available per unit of time. Renewable energy resources include biomass, hydro, geothermal, solar, wind, ocean thermal, wave action, and tidal action."
On the other hand, the EIA, in the context of transportation fuels, defines alternative fuels as fuel that is "substantially not petroleum and would yield substantial energy security benefits and substantial environmental benefits." Of the energy sources we have considered so far, coal and natural gas are non-renewable energy sources. Nuclear, though not renewable, is often considered an alternative fuel source because it does not have greenhouse gas emissions associated with fossil fuels. Natural gas is considered by the EIA as an alternative transportation fuel. Other alternative fuels include biofuels such as ethanol and biodiesel.
The most commonly used renewable energy sources are hydroelectricity, wind, biomass, solar, and geothermal. In this course, we are going to look closely at hydropower and biomass (this lesson) and wind and solar (next lesson), since they are by far the most-used sources in the world.
According to the International Energy Agency's (IEA's) 2019 "Key World Energy Statistics" renewable energy accounted for around 13.8% of total primary energy supply (TPES) in 2017, down from 14.1% in 2014 and even with the13.8% in 2013 (2017 is the most recent year for which global data are available). Note that this includes "waste" which in part consists of municipal, commercial, and industrial waste (i.e., garbage) that is burned and used to generate electricity and/or heat (see the glossary for an explanation). Believe it or not, it is standard practice to consider waste incineration as renewable energy, regardless of the composition of the waste. Whether or not this is valid is a debate for another time, but for now, we'll consider it renewable since it cannot be disaggregated from biomass in the IEA data.
Primary energy refers to energy in its "original" form, in other words "before any transformation to secondary or tertiary forms of energy" (source: US EIA). For example, coal is a primary energy source, but any electricity or heat it generates is not. Renewable energy sources are also primary energy sources, as are oil, nuclear, and natural gas (but again, any electricity generated from non-renewable sources is not primary energy). Total primary energy supply (TPES) refers to all primary energy used in a given geographical area.
Click here to see a text description of Figure 8.1.
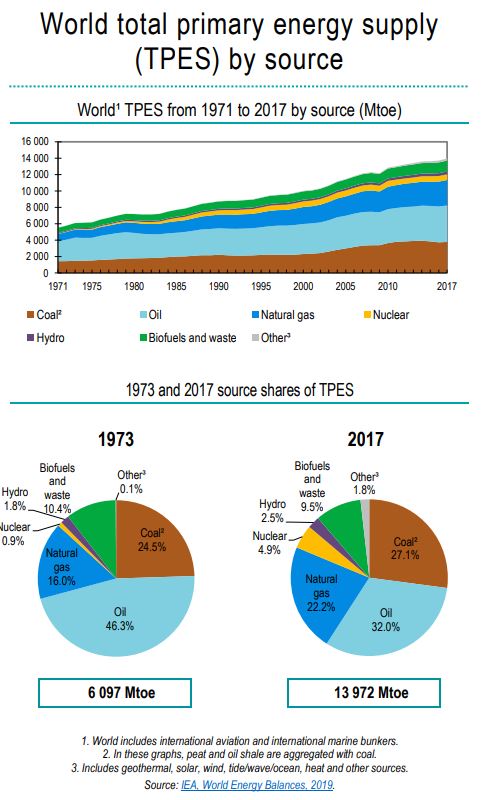
World total primary energy supply (TPES) by fuel
The first graph shows the World* TPES from 1973 to 2017 by fuel (Mtoe) showing that all fuel types have been rising steadily. The fuel types include coal (including peat and oil shale), oil, natural gas, nuclear, hydro, biofuels and waste, and other (including geothermal, solar, wind, tide/wave/ocean, heat and other). *The world includes international aviation and international marine bunkers.
The following table compares 1973 and 2017 energy supply by source.
| Energy Type | 1973 | 2017 (2015) |
|---|---|---|
| OIl | 46.3% | 32.0% (31.7%) |
| Coal | 24.5% | 27.1% (28.1%) |
| Natural Gas | 16.0% | 22.2% (21.6%) |
| Nuclear | 0.9% | 4.9% (4.9%) |
| Hydro | 1.8% | 2.5% (2.5%) |
| Biofuels and Waste | 10.4% | 9.5% (9.7%) |
| Other | 0.1% | 1.8% (1.5%) |
| Total Mtoe | 6097 | 13,972 (13,647) |
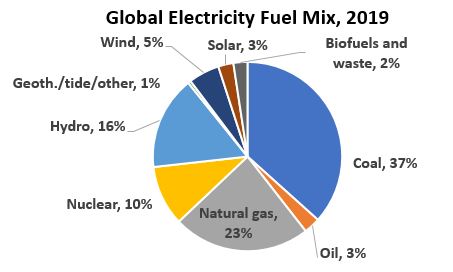
According to the IEA, about 27% of all electricity generation worldwide was from renewables in 2019 (up from around 24% in 2015), and is predicted to rise to 28% by 2021 (these are the most recent data available from IEA). Renewable energy accounted for over half of all net electric power capacity additions in 2015, which is the first time that they have accounted for more than 50%. This was led by onshore wind at 63 GW (gigawatts, or billion Watts) and solar photovoltaics at 49 GW (both of these will be addressed in the next lesson).
The IEA reported in 2021 that "renewables are expected to account for 90% of total global power capacity increases in both 2021 and 2022." 90%! That is a staggering number, and is led by wind and solar installations across the world, despite the fact that China had been opening about one coal plant per week in 2020.
Energy and Power
Hopefully, this is a refresher at this point, but because it is so important and so easily confused, let’s be certain…
Power is the rate at which work is performed or energy is converted from one form to another. A car, for example, will have a power rating in “horsepower.” This power rating basically indicates how fast the car can convert chemical energy (from the fuel) into kinetic energy (motion). The power rating is separate from how fast or how far the car actually goes. For example, a 1967 Corvette with a 435 hp power rating will have that rating whether it is sitting in the driveway, rolling along a country road, or racing around a track. But while in operation, the engine's actual hp (the rate the energy is physically being converted) can increase and decrease.
Similarly, a light bulb has a power rating measured in watts. In this case, the light bulb is transforming electrical energy into heat and light. The higher the wattage, the higher the rate of energy transformation. And like our car engine, the power rating stays the same whether the light bulb is on or not. A 75-W bulb is always a 75-W bulb.
To understand energy, think about your power bill. You don’t get a bill for how many light bulbs you have, or how many watts they are. You get a bill for how much you use them. And when you use them, they use energy (electrical energy). The amount of electricity (energy) they use is measured in kilowatt hours (kWh). In two hours, a 150-W bulb will use 300 Wh of electricity (150 W x 2 h = 300 Wh). Since there are 1,000 Wh in a kWh, this is 0.3 kWh. A 50-W bulb will use 100 Wh in the same amount of time (0.1 kWh).
When we refer to electricity generation of power stations (including hydroelectric, wind, and solar), the systems themselves have a power rating that is in watts (or kW or MW). This is generally referred to as capacity. You can think of capacity as the maximum power output of an energy source. For example, a 1 MW (megawatt, or million watt) power plant has a peak electric power output of - you guessed it - 1 MW. If it operates at full capacity for 1 hour it would generate 1 MWh (1 MW x 1 hr) (a MWh is a megawatt-hour, which should ring a bell because SRECs are measured in MWh). If it operated at full capacity for one day it would output 24 MWh (1 MW x 24 hr).
Wind and solar energy are notoriously intermittent, but even coal and natural gas power plants have downtime. Nuclear power plants generally operate at near capacity most of the time and are viewed as one of the most reliable renewable energy sources. Hydroelectricity can be designed to operate at near full capacity, but generally, do not. The capacity factor of an energy source is determined by dividing the actual energy generation over a given period of time by the maximum possible generation over that same period (hopefully this sounds familiar, as it was the subject of a question in an earlier homework). Capacity factor generally refers to a year or an average year of generation but can refer to any amount of time. In the example above, if the 1 MW power plant output 12 MWh in one day, the capacity factor for that day would be 50% (12 MWh/24 MWh = 50%). Nuclear tends to have an average capacity factor above 90%, while hydroelectricity hovers in the 40% range. See this table from the EIA for the average capacity factors of different non-fossil fuel sources of electricity in the U.S., and this table for fossil-fuel capacity factors.
Generation is the amount of electricity generated (should be easy to remember!) by an energy-generating system. The amount of electricity a system generates can be measured in kWh, but can also be measured in MWh (million Wh) or GWh (billion Wh), or even TWh (trillion Wh). The amount of electricity a hydroelectric power plant will generate is basically determined by the plant's capacity and the amount of fuel (moving water), and whether or not full output is desired at the time. The amount of electricity a solar array will generate is basically determined by the solar array’s capacity and the amount of fuel (sunshine). The amount of electricity a wind turbine will generate is determined by the turbine’s capacity and the amount of fuel (wind) that is being provided at the time.
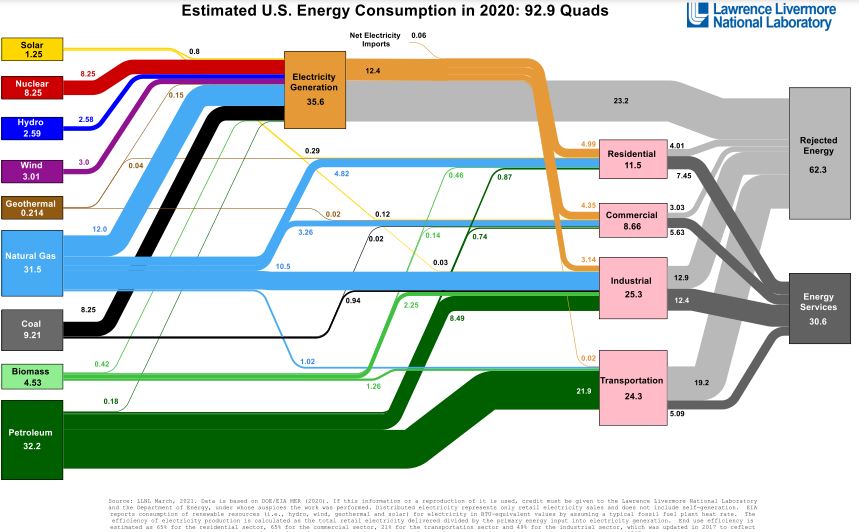
U.S. Energy Use
The image below illustrates the total energy flows in the U.S. in 2020. All the fuel sources on the left are primary energy sources, and the quantities are given in quads (a quad is one quadrillion BTUs, or 1 x 10¹⁵ BTUs). The image indicates how each energy source is used, and how much is wasted ("rejected"), mostly as heat. (You can click on the image to see a larger and resizable version.) You can view a short explanation of this chart by a representative from Lawrence Livermore National Laboratory (LLNL), the U.S. national lab that generates this chart every year.
Lawrence Livermore National Laboratory also publishes an annual carbon emission flow chart (this type of "flow" chart is called a Sankey diagram). The 2018 chart (the most recent available) can be seen below. Note that the subjects of this Lesson (hydroelectric and biomass) and the next lesson (solar and wind) do not account for any of the U.S.'s carbon footprint.

Biomass
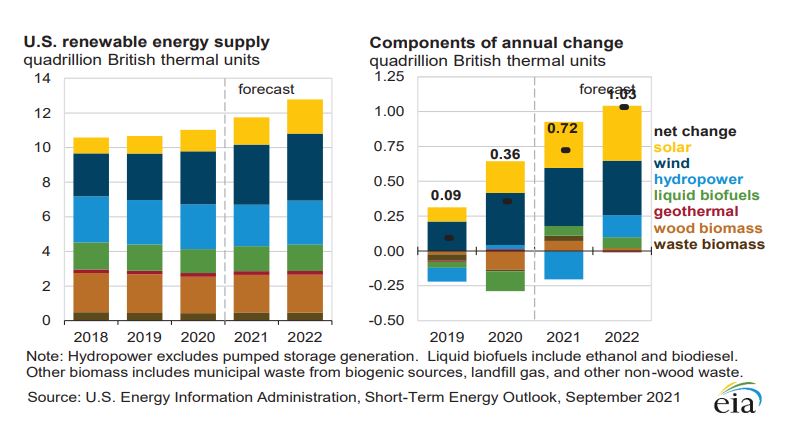
The table and chart below comes from the EIA's monthly report, "Short-Term Energy Outlook," September 2021. (Commonly referred to as STEO).
| Energy Source | 2017 | 2018 | 2019 | 2020 |
|---|---|---|---|---|
| Hydroelectric Powera | 3.640 | 7.031 | 2.492 | 2.592 |
| Geothermal | 0.300 | 0.578 | 0.209 | 0.214 |
| Solar | 1.021 | 2.170 | 1.043 | 1.246 |
| Wind | 3.197 | 6.479 | 2.729 | 3.065 |
| Wood Biomass | 3.121 | 6.109 | 2.297 | 2.101 |
| Ethanol | 1.694 | 3.284 | 1.200 | 1.045 |
| Biomass-based diesel | 0.424 | 0.777 | 0.265 | 0.275 |
| Waste Biomassb | 0.705 | 1.356 | 0.433 | 0.430 |
| Biofuel losses and co-productsc | 1.163 | 2.266 | 0.800 | 0.698 |
| Total | 15.236 | 29.990 | 11.441 | 11.657 |
Biomass clearly comes from a variety of sources, so what is biomass? In the table above, it is wood biomass, waste biomass, ethanol, biomass-based diesel ("biodiesel"), and biofuel losses and co-products. Is it me, or does it seems like other renewable sources like solar and wind get most of the press? Don't get me wrong - these are great sources, but biomass is by far the largest single source of renewable energy both in the U.S. and worldwide. Altogether, about 38% of renewable energy consumed in the USA in 2020 came from biomass sources (not included the biofuel losses and co-products). About the same amount as wind and solar combined!
What is Biomass?
Biomass is "organic nonfossil material of biological origin constituting a renewable energy source." (Source: EIA). Why the word "nonfossil?" We know that fossil fuels are formed in the Earth's crust from decayed organic material. So why aren't fossil fuels considered "biomass"?
Another definition describes biomass as "derived from living, or recently living organisms." This is the trick: the difference is one of time scale. "Fossil fuels such as coal, oil, and gas are also derived from biological material, however material that absorbed CO2 from the atmosphere many millions of years ago" (Biomass Energy Centre). Biomass then is a renewable energy source, as indicated by the EIA definition, and thus is "virtually inexhaustible in duration but limited in the amount of energy that is available per unit of time." Biomass differs from other renewables such as solar and wind because, in addition to being limited in availability, it is possible to use it at a much higher rate than it can be replenished. Think of a clear-cut forest or decimated cornfield.