
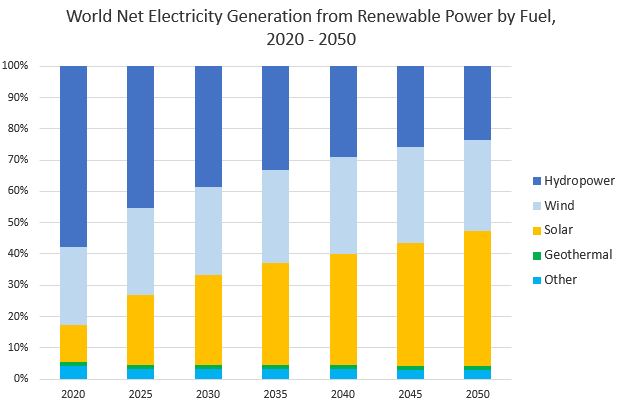
In 2020, about 28% of the world's electricity was generated from renewable energy sources. Of that, about 57% came from hydropower (down from 77% in 2012). Between 2020 and 2050, the Energy Information Administration (in the IEO2021 Reference case) projects that hydropower generation will increase 1.1% per year, while renewable electricity is expected to grow by over 4% per year. Because of this, the EIA projects that hydropower will drop to just over 29% of the total renewable energy generation in 2040 and 23% of the total renewable energy generation in 2050. (Just a few years ago, they projected over 50% in 2040. They did not expect solar and wind to grow as rapidly as they have.) This drop in total percentage is very apparent in the chart below. (Note that the chart below uses the same data as the chart on the previous page, but is expressed as a percentage instead of total generation.)
Click link to expand for a text description of Figure 8.8
| Fuel Type | 2020 | 2025 | 2030 | 2035 | 2040 | 2050 |
|---|---|---|---|---|---|---|
| Other | 291.3 | 332.8 | 399.7 | 488.7 | 556.7 | 689.5 |
| Geothermal | 09.1 | 129.3 | 188.4 | 214.0 | 238.6 | 253.9 |
| solar | 831.9 | 2274.8 | 3655.6 | 4948.8 | 6391.4 | 10152 |
| Wind | 1741.4 | 2814.2 | 3583.5 | 4532.7 | 5525.6 | 6833.5 |
| Hydropower | 4034.3 | 4619.6 | 4921.4 | 5065.2 | 5337.0 | 5548 |
In their "2020 Hydropower Status Report" (an outstanding resource for international hydropower trends!) the International Hydropower Association (IHA) reports that 15.6 GW of new hydropower capacity was installed in 2019 (down from 21.9 GW in 2017 and 33.7 in 2015). At the end of 2019, worldwide hydropower capacity was about 1,308 GW (up from 1,036 GW in 2014). Total generation was a record 4,306 TWh, which was "the single greatest contribution from a renewable energy source in history", which IHA states avoided "an estimated 80 - 100 million metric tonnes of carbon emissions." Brazil led all other countries in increased capacity, with over 4.91 GW of growth in 2019, followed closely by China at 4.17 GW of additional capacity.
Types of Hydropower Plants
There are three general types of hydropower stations:
Run of River (or Diversion), electricity is generated through the flow of a river.
Reservoir (or Impoundment), flowing water is stored in a reservoir where the release of the water to generate electricity can be controlled.
Pumped Storage, where water is pumped from a lower reservoir to a higher reservoir, so that it can be released to generate electricity when needed.
To Read Now
- Visit the Office of Energy Efficiency and Renewable Energy (EERE) and read "Types of Hydropower Plants"
Also read the following to get a sense of how hydropower works, particularly in impoundment systems:
- From the U.S. Geological Survey, read "The flow of water produces hydroelectricity" and "Hydroelectric Power: How it Works"
- From the Tennessee Valley Authority, read "How Hydroelectric Power Works" and watch the embedded video.
After reading through the information on the link above, please watch the following (3:50) video from the U.S. Department of Energy.
To Read Now
Visit the Foundation for Water & Energy Education.
Take the Walk Through a Hydro Project tour, click through all 10 steps.
Optional
Take the Fish Passage tour, click through all 5 features (Spillways, Turbines, Juvenile Fish Transportation, Bypass Systems, Fish Ladders).
To Read Now
Read an article from Yale 360 that illustrates how pumped storage can be integrated with other renewable energy sources.
A fourth emerging type of hydropower is marine and hydrokinetic, where electricity is generated from the energy of waves, tides, ocean, and river currents. Data are hard to come by, but in their 2013 Hydropower Report the International Hydropower Association estimates global installed tidal and ocean capacity was about 515 MW at the of 2012, with roughly an additional 3,000 MW of "pipeline capacity" (planned).