
Energy Storage
The notion of energy storage is fairly straight forward and simple from a business context. In business we would call it “inventory.” This is the notion that we should have enough supply in stock to meet demand on a timely basis. In the context of a supermarket, the grocer would have a certain number of cartons of eggs, for instance, so that throughout the day as customers showed up, there would be eggs available to be bought. Energy as a good is slightly different from eggs, though. Certain forms of energy can be stockpiled or inventoried like gasoline in your car’s tank or natural gas in a storage reservoir. Other forms of energy must be produced at exactly the same time as they are consumed. This is mainly true for electricity, which must be balanced on any hourly basis. Natural gas loads are balanced with supply on an hourly basis as the commodity can be stored and pressures can fluctuate to allow for peaks and troughs in delivery. The storage of energy allows us to match supply with demand on a timely basis (instantaneously, hourly, daily, seasonally, annually).
In the case of natural gas we have a storage network by state that looks like this in the US:
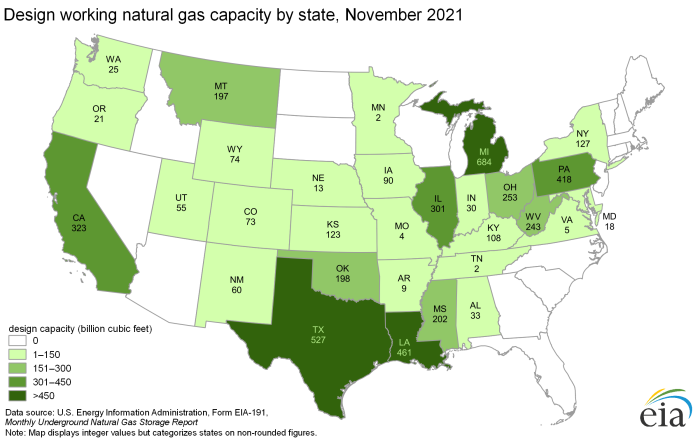
| Billion Cubic Feet | States |
|---|---|
| 0 | NV, ID, AZ, ND, SD, WI, ME, VT, NH, MA, RI, CT, NJ, NC, SC, GA, FL |
| 1-150 | WA, OR, WY, UT, CO, NM, NE, KS, MN, IA, MO, AR, IN, KY, TN, AL, VA, NY |
| 151-300 | MT, OK, MS, OH, WV |
| 301-450 | CA, IL, PA |
| >450 | TX, LA, MI |
Check out the US Energy Information Administration site's Natural Gas page for some interesting discussion about natural gas storage.
In terms of the types of storage and the locations, please see the map below (Figure 13.2).
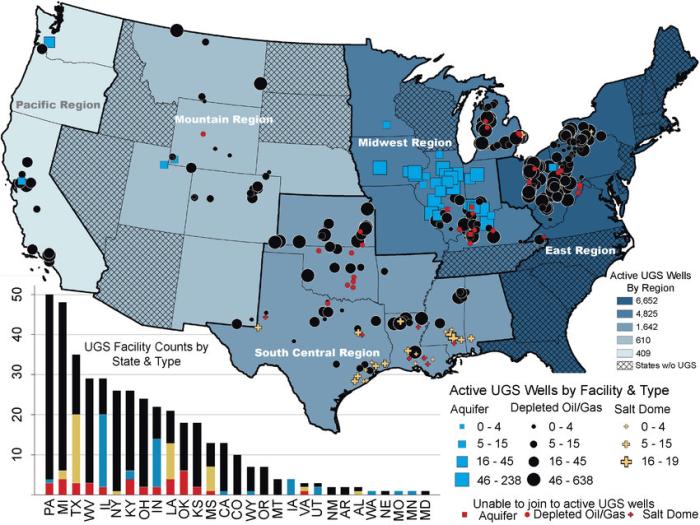
This US map shows active UGS wells by region, active UGS wells by facility and type, and UGS facility counts by state and type. Most active UGS wells are in the Eastern, Midwestern, and South Central regions of the US. Active UGS wells include aquifers, depleted oil/gas wells (PA, MI, and TX have most), and salt dome wells. Most aquifers are located in the Midwest (IL has most), most depleted oil/gas wells are concentrated in the Mid-Atlantic region, and most salt dome wells are in the Gulf region (TX, LA, and MI have most).
Natural gas can be stored in underground caverns for release on a seasonal, monthly, daily and intra-day basis. The need to balance the system is not necessarily instantaneous, but there does need to be gas available to meet sudden increases in demand (usually due to cold weather).
The electricity grid, though, must be able to meet increases and decreases in demand on an instantaneous basis. This means that until recently, almost all fluctuations in electricity demand were met by ramping a power plant up or down. With the advent of intermittency on the generation side, the value of the ability to meet less predictable fluctuations has increased the interest in electricity storage. Please see the diagram below for insight into the technologies being considered as we transition to a more flexible energy delivery system. The diagram shows how various technologies are positioned to provide services to the electricity grid. On the x-axis is depicted the scale in terms of the capacity of the resource in Ws. On the y-axis, we see the temporal ability of the resource in terms of seconds, minutes, and hours. The selected technology then appears at an intersection of those two variables (capacity and size). For instance, a nickel-cadmium battery can provide up to 200 kW in the second-to-minute range, making it a good resource to provide Uninterrupted Power Supply (UPS) or Power Quality services.
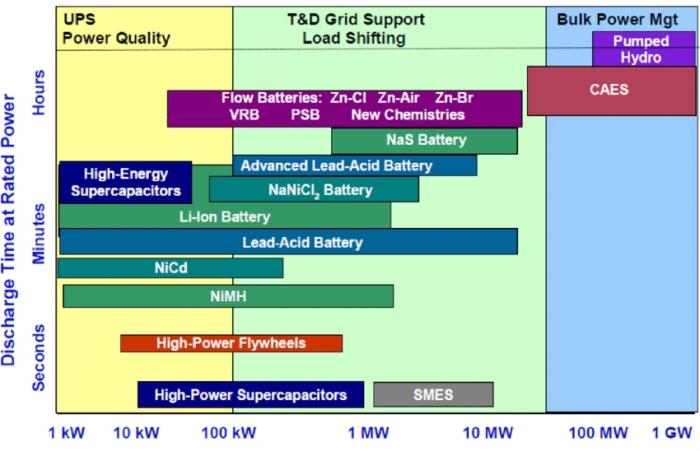
The diagram shows how various technologies are positioned to provide services to the electricity grid. On the x-axis there is depicted the scale in terms of capacity of the resource in Ws. On the y-axis we see the temporal ability of the resource in terms of seconds, minutes and hours. The selected technology then appears in an intersection of those two variables (capacity and size). For instance, a nickel-cadmium battery can provide up to 200 kW in the second to minutes range making it a good resource to provide Uninterrupted Power Supply (UPS) or Power Quality services.