
What is Commodity Price Risk?
Commodity Price Risk: "The possibility that commodity price changes will cause financial losses for either commodity buyers or producers" (Investopedia.com).
Let us think about some examples of commodity price risk. Think, for example, about a natural gas consumer in the month of October. This company is thinking about how there is a heating season coming up and how natural gas might be trading at $3.00 per MMBtu and how he knows that natural gas prices can go up significantly during the winter months because demand for natural gas increases significantly in the heating season. Now the natural gas consumer in this situation is what is called a “natural short” - meaning that the consumer has a requirement that has not been contracted for or fulfilled. This natural short position places them at significant budgetary risk should prices increase, as they can, in the winter period. Should prices rise from $3.00 per MMBtu to $4.50 per MMBtu, the commodity portion of their natural gas exposure would rise 50%.
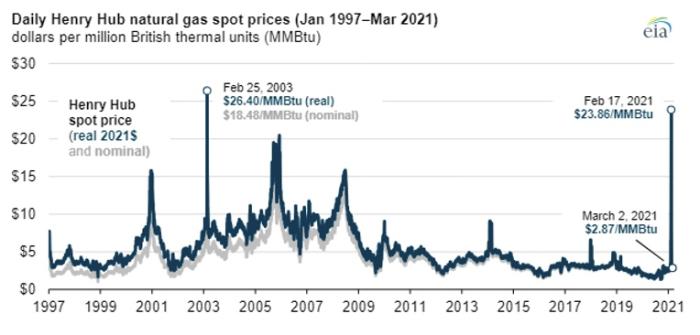
As you can see from the graph above, the volatility of the natural gas market could definitely produce this kind of risk for the consumer.
Another example of commodity price risk is that which might be experienced by a producer of a commodity. Imagine, for instance, if one were a solar developer. The solar developer wants to sell his electricity into the market to be able to pay his creditors and earn a return. If the revenue (which is equal to the quantity of electricity times the price of the electricity for the period in question) is subject to large swings in the price, the entire value proposition of the project could be at risk. This is one of the most important risks to any energy project and one that the savvy project developer (you, in this course) will want to mitigate.
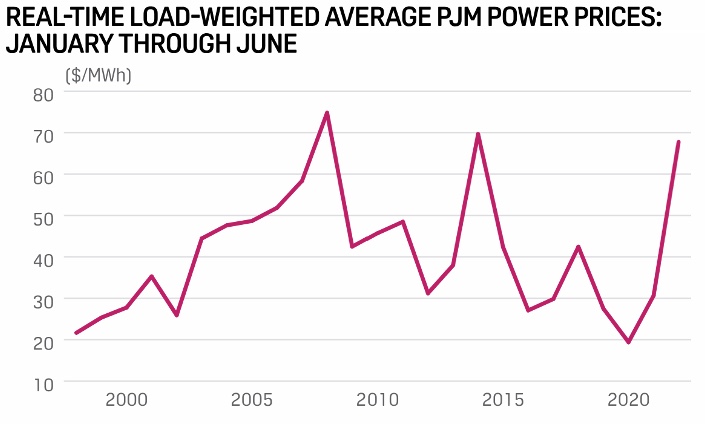
Above is some significant electric price volatility over a 20 year period (remember - your project is likely 25-30 years). Mitigating this risk would be very important for investors in your project. Mitigating Commodity price risk can take on many forms (and we will go into more detail at the end of this lesson), but probably the simplest form would be to engage in a transaction to fix the price. The natural gas consumer above would likely estimate their usage (or burn) for the volatile period and fix the price for that volume in $/MMBtu. This consumer would then have much less heartburn over the winter period, since the indigestion of worrying about gas prices would not arise. The consumer simply buys a contract for delivery of natural gas at the current price. Similarly, the power developer would want to fix the price for its output for the term of the contract in $/MWh. Both of these simple strategies allow for more stable cash flows over a season or a project life.