
8.3. Environmental assessment of CSP Technology
As a technology based on the renewable solar resource, the CSP has a great potential to reduce greenhouse gas (GHG) emissions. Emissions typically associated with conventional electricity production result from coal or natural gas burning and have been a severe factor in global pollution in climate change. Hence, installation of CSP offsets generation from fossil fuel plants. It does not mean, however, that CSP technology is emission free: while operational emissions are negligible compared to fossil-fuel power plants, lifecycle emissions may be still significant. To estimate the GHG emission level and the magnitude of the emission reduction benefit, one can employ Life Cycle Assessment (LCA) - a comprehensive methodology dealing with inventory of all processes and materials involved in a technology.
Life Cycle Assessment (LCA) methodology
Life Cycle Assessment (LCA) is a “cradle-to-grave” approach for assessing products, processes, industrial systems, and the like. “Cradle-to-grave” begins with the gathering of raw materials from the earth to create the product and ends at the point when all materials are returned to the earth. LCA evaluates all stages of a product's life from the perspective that they are interdependent, meaning that one operation leads to the next. LCA enables the estimation of the cumulative environmental impacts resulting from all stages in the product life cycle, and, as a result, allows selecting a path or process that is more environmentally benign.
LCA helps decision-makers select the product, process, or technology that results in the least impact to the environment. This information can be used with other factors, such as cost and performance data, to find optimal solutions. LCA identifies the transfer of environmental impacts from one media to another (for instance: a new process may lower air emissions, but creates more wastewater, etc.) and between different lifecycle stages. The diagram below illustrates the main lifecycle stages to be considered in LCA:
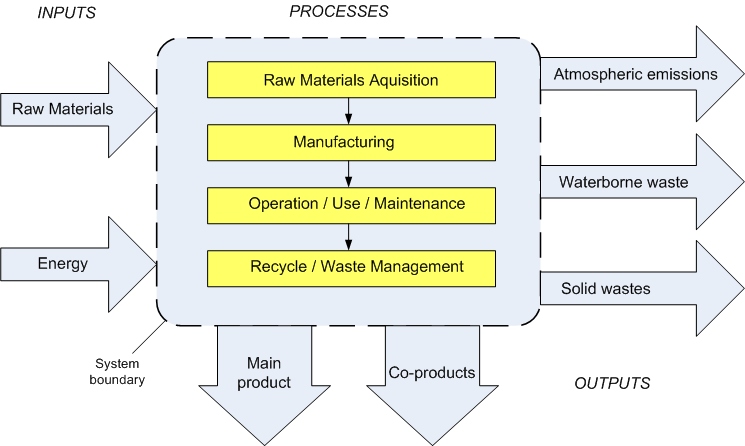
Figure 8.2. The main flows and stages considered in lifecycle assessment.
The diagram above lists the main stages of product lifecycle: (1) raw material acquisition, (2) manufacturing / construction, (3) operation or use, and (4) recycling or waste disposal (decommission stage). Each of these stages has inputs of materials and energy and outputs of atmospheric emissions, waterborne wastes and solid wastes. Each stage creates the main useful input to the next stage, and usually the operational stage of the lifecycle is where the main product of the technology is produced. Any co-products (desirable or undesirable) are also identified and taken into account in the analysis. The LCA based on this scheme is a complex process (even for small systems), which requires large amount of data and interdisciplinary expertise for proper assessment. A typical LCA project plan includes the following main steps:
- Goal definition and scope: Identify a product / process / technology; establish context and system boundaries.
- Inventory analysis: Identify and quantify energy, water, and materials as inputs as well as environmental releases as outputs.
- Impact assessment: Assess the potential human and ecological effects, quantify metrics.
- Data interpretation: Compare data from Inventory Analysis and Impact Assessment stages to select or recommend a preferred product, process, or technology.
LCA Limitations:
- LCA thoroughness and accuracy will depend on the availability of data; gathering of data can be problematic; hence, a clear understanding of the uncertainty and assumptions is important.
- Classic LCA will not determine which product, process, or technology is the most cost-effective or top-performing; therefore, LCA needs to be combined with cost analysis, technical evaluation, and social metrics for comprehensive sustainability analysis.
- Unlike traditional risk assessment, LCA does not necessarily attempt to quantify any specific actual impacts. While seeking to establish a linkage between a system and potential impacts, LCA models are suitable for relative comparisons, but may be not sufficient for absolute predictions of risks.
- The standardized procedure for the LCA recommended for product and technology assessment in the U.S. is documented in the EPA guidelines referenced below.
Life Cycle Assessment: Principles and Practice, EPA/600/R-06/060, 2006.
LCA Methodology Applied to CSP Plants
When the LCA analysis is applied to a CSP plant, a number of impact metrics need to be identified. One of them, as mentioned above, is greenhouse gas emissions, but there are also other impacts that involve environmental harm. Other typically assessed impacts are acidification and eutrophication potential. Acidification is referred to as increase in acidity of natural waters and soils. It may cause loss of aquatic life, forests, and other plants in the area and increase ecotoxicity. Eutrophication is related to nutrient enriching in aquatic and terrestrial environments. It can cause harm to ecological system through a chain of feedbacks, change in dissolved oxygen contents.
With respect to above metrics, CSP offers significant benefits, according to various studies reviewed in Lovegrove and Stein (2012). Values of GHG emissions by CSP plant (in case of solar only operation - no hybrid systems with natural gas backup) are estimated in the range from 11 to 90 g CO2 equivalent per kWh of electric energy generated. For central tower plants, the emissions are on the lower side, and for the parabolic trough plants, the emissions are on the higher side of that range; but, in either case, these numbers are well below the values typical for other electricity generation facilities (Table 8.2).
| Technology | GHG emissions g CO2 equiv/kWh |
|---|---|
| CSP (solar thermal) | 11-90 |
| Solar photovoltaic (PV) | 57-109 |
| Nuclear power | 14 |
| Heavy oil condensing | 726 |
| Light oil gas turbine | 436 |
| Coal/lignite | 690-820 |
| Natural gas combined cycle | 391 |
The CSP emissions have been shown to increase by 650 g CO2 equiv./kWh if a fossil-fuel back-up is used and by 60 g CO2 equiv./kWh if heat storage is used. The different studies indicate that CSP's GHG emissions are mainly associated with steel and concrete used in solar field and tower, and salts used in storage systems. The use of synthetic salts instead of naturally mined salts for storage system results in an increase in GHG emissions by ~13 g CO2 equiv/kWh. Also, non-renewable electricity and materials may be used at the manufacturing stage of the project and in transportation to the site. It is known that the use of dry-cooling system instead of wet-cooling system increases GHG emissions by ~2 g CO2 equiv/kWh.
Acidification impact of CSP reported in the range 70-100 mg SO2 equiv/kWh. In case of hybrid plant (solar + fossil fuel backup), this number is substantially higher - 590-612 mg SO2 equiv/kWh. In case of eutrophication, the impact range is 6-10 mg PO4/kWh for solar only mode and ~50 PO4/kWh for hybrid mode.
It is important to note that these impacts take place during the operational phase only because the plant consumes power from the grid rather than power being produced on site.
A published study by Lechon and co-authors (2008), referenced below, describes the LCA analysis for CSP systems in more detail. The first two sections of the article define the method and scope of LCA, so you can just briefly look through those. It is more important to look at the data tables that contain specifications of the assessed facilities and various metrics. Usually, LCA studies collect considerable amounts of data, and our goal here is to learn to read and to interpret that information.
Reading Assignment
Journal article: Lechon, Y., de la Rua, C., and Saez, R., Life Cycle Environmental Impacts of Electricity Production by Solar thermal Power Plants in Spain, J. Solar Energy Eng., 130, (2008).
This article is available through the PSU library system. See a copy of this article in Module 8 in Canvas.
As you can understand from the above article, the energy consumption at different stages of the system lifecycle is still the main source of the environmental impact. The numbers characterizing two different CSP facilities in terms of energy consumed and energy generated are listed in Table 3, which is the basis for finding the lifecycle emissions. Also, pay attention to Table 6, where the emissions are itemized by system component. This itemization can be helpful in finding engineering solutions to further decrease the environmental impact of the technology. Note that the plants assessed in this study are hybrid (solar thermal + natural gas 15%), and this is the reason for higher overall GHG emissions calculated for this case compared to solar-only values given in Table 8.2 above.
Check Your Understanding Question 7 (Multiple Choice)
Check Your Understanding Question 8 (Essay)
What sources of GHG emissions can you assume at the construction phase of the CSP plant?