Learning Objectives Self-Check
Read through the following statements/questions. You should be able to answer all of these after reading through the content on this page. I suggest writing or typing out your answers, but if nothing else, say them out loud to yourself.
Quick Quiz
It is a widely known fact that people can survive much longer without food than without water. Under optimal conditions, humans can go around a week, maybe a bit more, without water, whereas it is possible to go more than a month without eating food. But when water sustainability is being discussed, it is rare that death from lack of drinking water is the concern. A more likely cause of death (or, otherwise, a reduction in quality of life) is lack of clean water, and the water-borne diseases like diarrhea and cholera that result. Lack of access to water will likely be a very important problem in the future, though it also poses a threat right now.
Suggested Reading
The World Health Organization (WHO) was established by the United Nations (UN) in 1948. Its goal is "to build a better, healthier future for people all over the world" and its "staff work side by side with governments and other partners to ensure the highest attainable level of health for all people" (source: World Health Organization). They perform and fund research, write reports, establish international health recommendations/standards, provide aid throughout the world, and publish a LOT of data. They are a great source for information regarding international health (and sickness/disease).
- You are welcome to read the entire article, or you can just click below to read the key passages:"Drinking-water" by the World Health Organization.
Key facts
Over 2 billion people live in water-stressed countries, which is expected to be exacerbated in some regions as result of climate change and population growth.
Globally, at least 1.7 billion people use a drinking water source contaminated with faeces. Microbial contamination of drinking-water as a result of contamination with faeces poses the greatest risk to drinking-water safety.
Safe and sufficient water facilitates the practice of hygiene, which is a key measure to prevent not only diarrhoeal diseases, but acute respiratory infections and numerous neglected tropical diseases.
Microbiologically contaminated drinking water can transmit diseases such as diarrhoea, cholera, dysentery, typhoid and polio and is estimated to cause 505 000 diarrhoeal deaths each year.
In 2022, 73% of the global population (6 billion people) used a safely managed drinking-water service – that is, one located on premises, available when needed, and free from contamination.
Overview
Safe and readily available water is important for public health, whether it is used for drinking, domestic use, food production or recreational purposes. Improved water supply and sanitation, and better management of water resources, can boost countries’ economic growth and can contribute greatly to poverty reduction.
In 2010, the UN General Assembly explicitly recognized the human right to water and sanitation. Everyone has the right to sufficient, continuous, safe, acceptable, physically accessible and affordable water for personal and domestic use.
Water and health
Contaminated water and poor sanitation are linked to transmission of diseases such as cholera, diarrhea, dysentery, hepatitis A, typhoid, and polio. Absent, inadequate, or inappropriately managed water and sanitation services expose individuals to preventable health risks...
Inadequate management of urban, industrial, and agricultural wastewater means the drinking-water of hundreds of millions of people is dangerously contaminated or chemically polluted...
Some 1 million people are estimated to die each year from diarrhoea as a result of unsafe drinking-water, sanitation and hand hygiene. Yet diarrhoea is largely preventable, and the deaths of 395 000 children aged under 5 years could be avoided each year if these risk factors were addressed. Where water is not readily available, people may decide handwashing is not a priority, thereby adding to the likelihood of diarrhoea and other diseases.
Diarrhoea is the most widely known disease linked to contaminated food and water but there are other hazards. In 2021, over 251.4 million people required preventative treatment for schistosomiasis – an acute and chronic disease caused by parasitic worms contracted through exposure to infested water.
In many parts of the world, insects that live or breed in water carry and transmit diseases such as dengue fever. Some of these insects, known as vectors, breed in clean, rather than dirty water, and household drinking water containers can serve as breeding grounds. The simple intervention of covering water storage containers can reduce vector breeding and may also reduce faecal contamination of water at the household level.
Economic and social effects
When water comes from improved and more accessible sources, people spend less time and effort physically collecting it, meaning they can be productive in other ways. This can also result in greater personal safety and reducing musculoskeletal disorders by reducing the need to make long or risky journeys to collect and carry water. Better water sources also mean less expenditure on health, as people are less likely to fall ill and incur medical costs and are better able to remain economically productive.
With children particularly at risk from water-related diseases, access to improved sources of water can result in better health, and therefore better school attendance, with positive longer-term consequences for their lives.
Challenges
Historical rates of progress would need to double for the world to achieve universal coverage with basic drinking water services by 2030. To achieve universal safely managed services will require a 6-fold increase. Climate change, increasing water scarcity, population growth, demographic changes and urbanization already pose challenges for water supply systems...
The World Economic Forum (WEF) is a non-profit headquartered in Switzerland whose members are a who's who of the global economically elite corporations. The WEF is best-known for its annual meeting in Davos, Switzerland, which is frequently attended by world leaders, including the U.S. president. The WEF is often critiqued for not doing enough about income inequality and other issues facing the world's impoverished, but they do provide a lot of information that reflects the perspective of many of the world's economic leaders. This includes their annual Global Risks Report, which ranks what it sees as the top global risks in the next 10 years. Water figured prominently in the 2016 Global Risks Report. (The 2023 report focused more on a variety of environmental problems, including cllimate change, biodiversity loss and ecosystem collapse, and lumps water into "natural resource crises.")
You are welcome to read the entire press release, but here is the content most relevant to this lesson:
An increased likelihood for all risks, from the environmental to society, the economy, geopolitics and technology, looks set to shape the global agenda in the coming year, the World Economic Forum’s Global Risks Report 2016 has found.
...The risk with the greatest potential impact in 2016 was found to be a failure of climate change mitigation and adaptation. This is the first time since the report was published in 2006 that an environmental risk has topped the ranking. This year, it was considered to have greater potential damage than weapons of mass destruction (2nd),& water crises (3rd), large-scale involuntary migration (4th) and severe energy price shock (5th).
The number one risk in 2016 in terms of likelihood, meanwhile, is large-scale involuntary migration, followed by extreme weather events (2nd), failure of climate change mitigation and adaptation(3rd), interstate conflict with regional consequences (4th) and major natural catastrophes(5th).
Such a broad risk landscape is unprecedented in the 11 years the report has been measuring global risks. For the first time, four out of five categories – environmental, geopolitical, societal and economic – feature among the top five most impactful risks. The only category not to feature is technological risk, where the highest ranking risk is cyberattack, in 11th position in both likelihood and impact.
The following is some of the more important (and startling) information from the readings above:
- Globally, at least 1.7 billion people use a drinking water source contaminated with feces
- Contaminated water and poor sanitation are linked to transmission of diseases such as cholera, diarrhea, dysentery, hepatitis A, typhoid, and polio.
- Some 1 million people are estimated to die each year from diarrhea as a result of unsafe drinking-water, sanitation, and hand hygiene. Yet diarrhea is largely preventable, and the deaths of 395,000 children aged under 5 years could be avoided each year if these risk factors were addressed.
- Where water is not readily available, people may decide handwashing is not a priority, thereby adding to the likelihood of diarrhea and other diseases.
- Climate change, increasing water scarcity, population growth, demographic changes and urbanization already pose challenges for water supply systems. Over 2 billion people live in water-stressed countries.
While this paints a bleak picture, some progress has been made in the global fight for access to clean water, as evidenced by the fact that the UN's Millennium Development Goal (MDG) on drinking water has been met. The MDG was to "halve the proportion of the world's population without sustainable access to safe water." This goal was met in 2010. However, the article indicates that while the broad goal was met (global percentage), none of the 48 "least developed" countries met the goal.
As usual, there is a deficiency in terms of equity with regards to access to clean water, with "low-income, informal or illegal" populations "usually having less access to improved sources of drinking-water than other residents." The consequences are dire, as around 1 million people are estimated to die each year from diarrhea alone, including nearly 400,000 children under the age of 5. And over a quarter of a billion people had to be treated for schistosomiasis, which is a painful chronic disease also caused by water contamination. The worst part is that this is mostly preventable!
These and other factors combine to make access to water an essential part of quality of life. The United Nations has declared access to water and sanitation a human right and thus should be provided to all people equitably. The UN realizes that access is a fundamental component of the ability to live one's life and further that "clean drinking water and sanitation are essential to the realization of all human rights" (Source: United Nations).
All of this is reflected in the World Economic Forum's (WEF) Global Risk Report 2016, which ranked water as the third highest global risk in terms of "impact." (The 2019 report lists it as number 4 in terms of impact.) Note that the WEF did not rank water crisis on a large scale as highly likely relative to other things, including extreme weather, but that if it does occur, it will be very impactful. This speaks to the importance of access to water.
Good to Know - Sustainable Development Goals
The United Nations declared its Millennium Development Goals in 2000. They focused on 8 themes, each with many practical steps listed as ways to achieve the goals:
- Eradicate extreme poverty and hunger
- Achieve universal primary education
- Promote gender equality and empower women
- Reduce child mortality
- Improve maternal health
- Combat HIV/AIDS, Malaria, and other diseases
- Ensure environmental sustainability
- Develop a global partnership for development
Actions were to be taken for a period of 15 years and assessed every year along the way. This period concluded in 2014, and in 2015 the UN published the final report assessing the progress toward the goals. You can view The Millennium Development Goals Report. This is optional reading but will give you a very good feel for a lot of the development activities undertaken by the UN.
These have been replaced by the Sustainable Development Goals. These were adopted by the UN in 2015 as part of the 2030 Agenda for Sustainable Development. According to the UN, this agenda "provides a shared blueprint for peace and prosperity for people and the planet, now and into the future. At its heart are the 17 Sustainable Development Goals (SDGs), which are an urgent call for action by all countries - developed and developing - in a global partnership. They recognize that ending poverty and other deprivations must go hand-in-hand with strategies that improve health and education, reduce inequality, and spur economic growth – all while tackling climate change and working to preserve our oceans and forests."
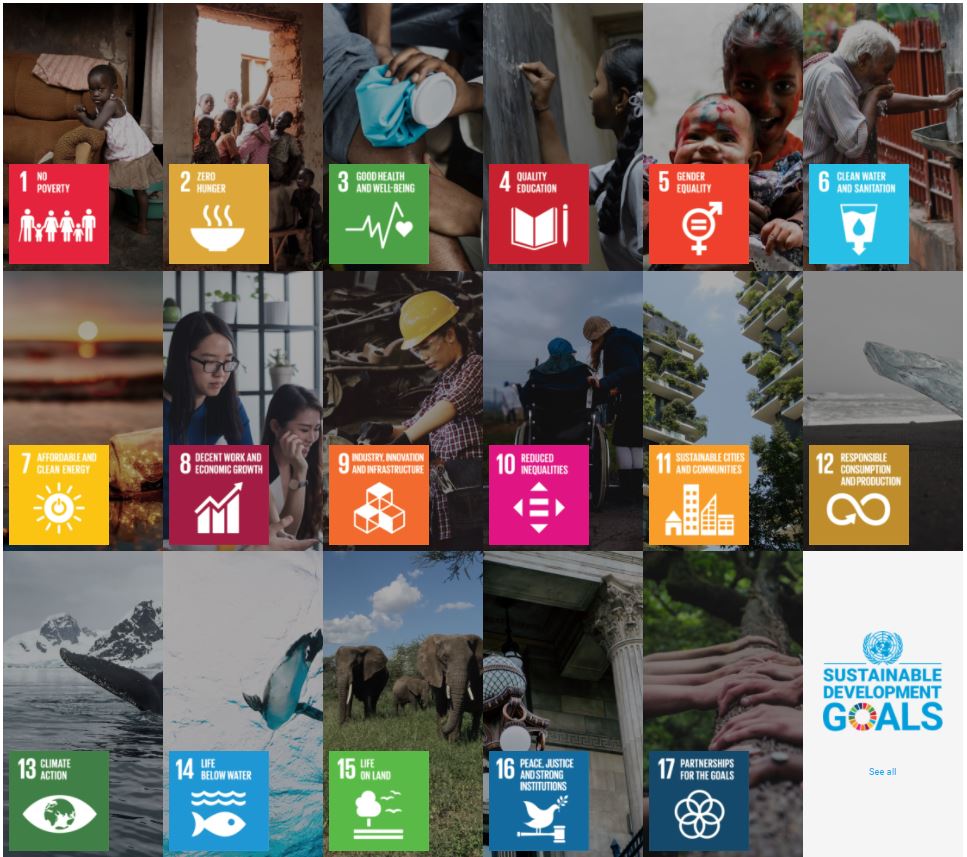
The SDGs are quite well known, and many public and private entities (and educational institutions) are using them to provide a framework for applying sustainability. The 17 Sustainable Development Goals are as follows. You will probably note that almost all of these are addressed to some extent in this course!
- No Poverty
- Zero Hunger
- Good Health and Well-Being
- Quality Education
- Gender Equality
- Clean Water and Sanitation
- Affordable and Clean Energy
- Decent Work and Economic Strength
- Industry, Innovation, and Infrastructure
- Reduced Inequalities
- Sustainable Cities and Communities
- Responsible Consumption and Production
- Climate Action
- Life Below Water
- Life on Land
- Peace, Justice, and Strong Institutions
- Partnerships for the Goals
Water Scarcity and Sectoral Use
The Food and Agriculture Organization of the United Nations (FAO) indicates that its goal is to "achieve food security for all and make sure that people have regular access to enough high-quality food to lead active, healthy lives" (Source: FAO). They are widely regarded as a leading international organization in the movement to alleviate malnutrition and food poverty across the world, particularly in impoverished areas of the world. In the video below (viewing is optional), they provide an introduction to the concepts of physical water scarcity and economic water scarcity and provide some data about these two phenomena.
- Physical water scarcity "occurs when the demand for water...is higher than the available resource." This is pretty straightforward: this occurs when an area needs more water than it has. This usually occurs in dry areas of the world, including wealthier ones like the southwestern U.S.
- Economic water scarcity "occurs when human, institutional and financial capital limit access to water even though water in nature is available for human needs." In other words, the water is there and is accessible, but the people are not capable of getting to it. This tends to happen in lower income countries of the world, and areas with social and/or political instability.
Source: FAO
Suggested Viewing
The following video from FAO has no audio narration, so there is nothing wrong with your speakers/headphones! Note that the data provided are a few years old, but have not changed much. It is important to point out that despite what is indicated in the video below, reducing domestic water use is not the most effective way to reduce total water use. As you will see in the video below, much more water is used as a result of farming and industrial uses worldwide.
Watch Water Scarcity by FAO Water (3:26 minutes).
It says: Water scarcity occurs when the demand for water from all sectors (agriculture, cities, environment, etc.) is higher than the available resource. Because water has been relatively abundant throughout our existence on earth, we have come to take it for granted. However, we now find our water supplies severely reduced as water scarcity is fast becoming one of the most serious resource issues we face today. The amount of water on our planet is fixed, but very little of it is available for us to use with about 2.5 percent of all water on earth being fresh water and 68.9 percent of the fresh water is locked in glaciers, 30.8 percent in groundwater, and 0.3 percent in lakes and rivers.
Currently, one third of the world population lives in countries where there isn't enough water or its quality has been compromised. By 2025 this number is expected to rise to two-thirds.
There are two types of water scarcity. One is known as Physical Water Scarcity. This occurs when there is not enough water to meet our needs. Arid regions are generally associated with physical water scarcity. Physical water scarcity occurs in: the western United States, Northern Africa, Saudi Arabia, Eastern Australia, and areas of India and northern China. More areas are rapidly approaching physical water scarcity. Africa, Asia and the Pacific, and the Near East use over 75 percent of their water for agriculture. The other type of water scarcity is known as Economic Water Scarcity. This occurs when human, institutional and financial capital limit access to water even though water in nature is available for human needs. Economic water scarcity occurs in central and northern South America, Middle Africa, and in and around India. Poor households in developing countries spend higher portions of their income on water than families in industrialized nations.
You may think water issues are somebody else's problem. But in a few years, it will be yours too. Follow a few easy steps to do your part in maintaining this precious resource. Don't throw your cooking oil down the drain. Close the tap when brushing your teeth. Don't buy unnecessary goods, as everything produced uses water.
Suggested Reading
You are welcome to read from the beginning through the "Water stress versus water scarcity" section on the United Nation's "International Decade for Action 'WATER FOR LIFE' 2005 - 2015," but that is not necessary. The key passages are summarized below. The full document provides a snapshot of water scarcity worldwide. This was the final report published by the UN after their decade-long focus on international water issues. I have highlighted some key elements in bold.
Water scarcity already affects every continent. Around 1.2 billion people, or almost one-fifth of the world's population, live in areas of physical scarcity, and 500 million people are approaching this situation. Another 1.6 billion people, or almost one quarter of the world's population, face economic water shortage (where countries lack the necessary infrastructure to take water from rivers and aquifers).
Water scarcity is among the main problems to be faced by many societies and the World in the XXIst century. Water use has been growing at more than twice the rate of population increase in the last century, and, although there is no global water scarcity as such, an increasing number of regions are chronically short of water.
Water scarcity is both a natural and a human-made phenomenon. There is enough freshwater on the planet for seven billion people but it is distributed unevenly and too much of it is wasted, polluted and unsustainably managed...
- Around 700 million people in 43 countries suffer today from water scarcity.
- By 2025, 1.8 billion people will be living in countries or regions with absolute water scarcity, and two-thirds of the world's population could be living under water stressed conditions.
- With the existing climate change scenario, almost half the world's population will be living in areas of high water stress by 2030, including between 75 million and 250 million people in Africa. In addition, water scarcity in some arid and semi-arid places will displace between 24 million and 700 million people.
- Sub-Saharan Africa has the largest number of water-stressed countries of any region
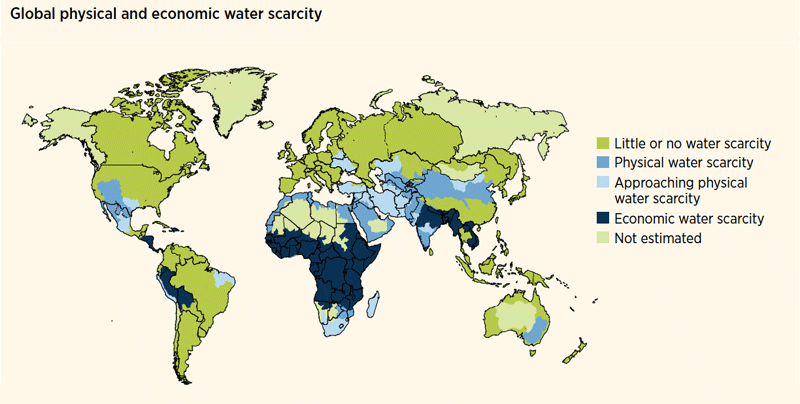
- Economic water scarcity: Sub-Saharan Africa, parts of Northwestern South America, Northern India an some of Southeast Asia
- Physical water scarcity: Northern China, parts of the Middle East, Southeastern Australia, Southwest U.S.
- Approaching physical water scarcity: Central Mexico and parts of Texas, South Africa, most of the Middle East, Some in Northern China.
- Little or no water scarcity: Most of the rest of the world, except for Alaska, Greenland, Siberian Russia, and Central Australia, which had no data.
The main takeaways from this video and article are:
- Economic water scarcity is when there is enough water in an area, but people don't have access to an adequate amount due to economic, political, or technological reasons
- Physical water scarcity is when there is not physically enough water to satisfy the needs of the people
- Arid areas being most prone to physical scarcity and those with social and/or political unrest most subject to economic scarcity;
- On a global scale, water scarcity is more of a distribution problem than a physical problem, according to the UN ("There is enough freshwater on the planet for seven billion people but it is distributed unevenly and too much of it is wasted, polluted and unsustainably managed.");
- Water scarcity impacts areas all over the world, including in some relatively wealthy countries.
- It is important to note that despite recent progress, the total number of people subject to scarcity or stress is likely to increase as population and water demand increase, and as the climate continues to change.
Quick Quiz
Suggested Viewing
The TED Talk below provides some great insight into the causes and effects of, and some solutions for, water scarcity. It also dispels some common misconceptions about the best ways to address this issue.
Watch Fresh water scarcity: An introduction to the problem (3:39 minutes)
You might have heard that we're running out of fresh water. This might sound strange to you because, if you live in a place where water flows freely from the tap or shower at any time, it sure doesn't seem like a big deal.
It's just there, right?
Wrong!
The only obvious thing about fresh water is how much we need it. Because it's essential to life, we need to think about it carefully. Right now, at this very moment, some people, women and girls in particular, walk hours and miles per day to get fresh water, and even then, it may not be clean. Every 15 seconds, a child dies due to water-born diseases.
This is tragic!
The most compelling reasons to think about fresh water, therefore, have to do with what we might call the global common good. This is not something we normally think about, but it means recognizing how much fresh water matters for the flourishing of human and non-human life on Earth now and in the future.
How do we think about something as local as our faucets and as global as fresh water? Is there a connection between them?
Many people assume that fresh water shortages are due to individual wastefulness: running the water while you brush your teeth, for example, or taking really long showers. Most of us assume, therefore, that water shortages can be fixed by improving our personal habits: taking shorter showers or turning off the water while we brush our teeth. But, global fresh water scarcity neither starts nor ends in your shower. Globally, domestic use of fresh water accounts for only 8% of consumption, 8%!! Compare that to the 70% that goes to agriculture and the 22% that goes to industrial uses.
Now, hold up - you're not off the hook!
Individual habits are still part of the puzzle. You should still cultivate water virtue in your daily life, turn off the tap when you brush your teeth. But still, it's true. Taking shorter showers won't solve global problems, which is too bad. It would be much more straightforward and easier if virtuous, individual actions could do the trick. You'd just stand there for 30 seconds less, and you'd be done with that irksome, planet-saving task for the day.
Well, that's not so much the case.
Agricultural and industrial patterns of water use need serious attention. How do our societies value water? Distribute it? Subsidize its use in agriculture? Incentivize its consumption or pollution?
These are all questions that stem from how we think about fresh water's value. Is it an economic commodity? A human right? A public good? Nobel prize winners, global water justice activists, transnational institutions like the United Nations, and even the Catholic Church are at work on the issue. But, it's tricky, too, because the business of water became very profitable in the 20th century. And profit is not the same thing as the common good. We need to figure out how to value fresh water as a public good, something that's vital for human and non-human life, now and in the future.
Now that's a virtuous, collective task that goes far beyond your shower.
Though this TED-Ed talk was produced in 2013, the same issues exist today. As the narrator indicates, only about 8% of global fresh water consumption is from domestic uses (showering, teeth brushing, cooking, etc.) Most - about 70% (!) - is used for agriculture, and over 20% is used for industrial purposes (e.g. manufacturing, energy generation). This is very similar to the U.S. water use profile, as you will see in a second.
The United States Geological Survey (USGS) is charged with compiling the U.S.'s water use data. The most recent report is from 2015, which was released in June of 2018. Feel free to tool around with the data here, and go here for an interesting visualization of water use by category and state.
The chart below shows the percent of consumption different sectors of use are responsible for. As noted above, very little is used domestically and in the public supply (around 13% combined). (Note that irrigating lawns and watering gardens at home counts as domestic use, not irrigation.) You may be surprised by some of this, in particular that thermoelectric cooling is the single biggest user of total water in the U.S. (Keep in mind that about 50 billion gallons of salt water are used for thermoelectric power, so irrigation is the biggest single freshwater user in the U.S.). Thermoelectric cooling just refers to cooling towers. Have you ever noticed that power plants are always located near a body of water? That is because the electricity generation process generates a LOT of waste heat. (Recall that power plants are generally 30% - 40% efficient, and so waste a lot of heat). Without constant cooling by a local water source, the plants would overheat.

| Category | 2015 WithdrawAls in Million Gallons per Day |
|---|---|
| Public Supply | 39,000 |
| Self-Supplied Domestic | 3,260 |
| Irrigation | 118,000 |
| Livestock | 2,000 |
| Aquaculture | 7,550 |
| Self-supplied Industrial | 14,800 |
| Mining | 4,000 |
| Thermoelectric Power | 133,000 |
Note: Values do not sum to 322,000 Mgal/d because of independent rounding.
- Total withdrawals were 322,000 million gallons per day (355 billion gallons per day).
- Thermoelectric power, irrigation, and public supply account for 90 percent of total withdrawals.
- Withdrawals declined since 2010 in all categories except irrigation.
- Freshwater withdrawals were about 88% of the total.
- Surface water supplied 78 % of all withdrawals
Suggested Reading
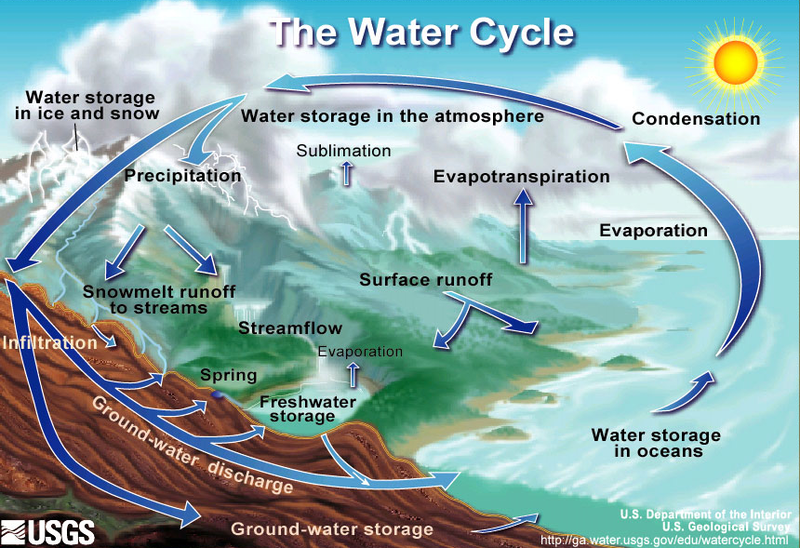
It is important to keep in mind that it's not as easy as knowing how much water is being used. Unlike coal, natural gas, or other non-renewable resources, once water is "used," it does not disappear. (Recall that we have the same amount of water on earth now as we have had for thousands of years.) Rather, water is just moved into a different part of the water cycle. For example, with thermoelectric cooling, liquid water is converted to water vapor. It is then in a different part of the cycle, but is eventually converted back to liquid water (and perhaps solid) in the form of precipitation. If that precipitation falls over the ocean, it may stay there for a few days, or thousands of years. (The amount of time it stays in storage is called the residence time). If water is used to grow a food crop, it may evapotranspire in a matter of days, or it may stay in the plant, only to be consumed by an animal, and then perhaps by us, where it will eventually end up somewhere else. The UCAR Center for Science Education (who operates the National Center for Atmospheric Research) provides the following average residence times in the water cycle. It is important to point out that these are average residence times, and they are careful to note that there are exceptions to this:
A drop of water may spend over 3,000 years in the ocean before evaporating into the air, while a drop of water spends an average of just nine days in the atmosphere before falling back to Earth.
Water spends thousands to hundreds of thousands of years in the large ice sheets that cover Antarctica and Greenland
...snow that falls in the winter may only stick around for a few days in mid-latitudes locations, where temperatures often rise above freezing causing the snow to melt, or up to six months closer to the Arctic
..Water stays in soil for around one to two months although this varies greatly.
Like many sustainability-related issues, freshwater availability is complex. When we use water, we may eventually get it back in a usable form. But keep in mind that when we use freshwater (e.g., to irrigate crops, cool power plants, etc.), much of it ends up as water vapor, and on average (according to UCAR) 80% of precipitation falls over the ocean, where the residence time is an average of 3,000 years. It is difficult to convert it back to freshwater when this happens. As you will see below, the overall trend is toward less freshwater being available. The take-home message here is that it is in our best interests to make sure we maintain an adequate level of freshwater as possible by minimizing& use.
Okay, now you have an idea of what water scarcity is, and know different ways that human activity moves a lot of water in and out of different parts of the water cycle. You've also seen some indication of global water contamination issues. If you want to learn about some evidence of water scarcity, read through the suggested reading below.
Suggested Reading
Two important questions remain: Are we at risk of running out of fresh water? If so, how do we know? The article below will help us answer these questions.
- "One quarter of the world's population live in countries with a high level of water stress," World Economic Forum
- "Is the world running out of fresh water?" Tim Smedley, BBC.
Water Footprint
Given that most water is used for things other than direct household use, it stands to reason that there are "hidden" water costs to many of the things we do, use, and consume. Take a look around you, and think about what you ate today and yesterday. Have you ever thought about how much water was used for all of that "stuff?" Have you ever seen a water use label on a pack of hamburgers in the store? How about a loaf of bread? The label on your jeans? Neither have I and just like me, you would probably be shocked to find out how much water is used to produce most things. The Water Footprint Network defines water footprint as "the amount of water used to produce each of the goods and services we use" (source: Water Footprint Network).
A water footprint - like an ecological footprint - can be calculated for individual products, individual people, or groups of people (communities, cities, countries, etc.). The folks at the Water Footprint Network provide a lot of information about water footprints. What is particularly nice about this organization is that they use peer-reviewed research as their information sources. The video below indicates some of the footprints of "everyday" products. The specific numbers are not meant to be gospel, but give you a good idea of water footprints. Note that the following 1 minute video has no audio narration.
This is how much water you use every day without even knowing. Enjoy a morning cup of coffee? That's 140 liters of water...just to grow the beans for a single cup. Staying clean is water intensive too...between 90 and 180 liters. Water is also used to make every item of clothing you wear. Your new T-shirt takes 2,720 liters and your favorite pair of jeans adds another 10,000 liters. Work in an office? Water use doesn't stop there. The office printer uses more than you think, as it takes 6,000 liters to produce one ream of paper. A single hamburger at lunch uses up 2,400 liters of water, mostly to grow the cattle feed. And the oranges in a single glass of juice take another 200 liters. Your drive home at the end of the day relies on water, with 177,000 liters used in the manufacture of a midsize car. An evening glass of wine uses as much water as your morning coffee. Leaving just enough for a glass of water before bed.
Take a look at the Water Footprint Network's product gallery to see the (often surprising) water footprint of many common items.
Water and Equity
As with other sustainability issues, problems associated with access to fresh water is most acute in disadvantaged areas of the world. This includes low-income countries - particularly those in arid or semi-arid regions like sub-Saharan Africa - but also in impoverished communities in otherwise wealthy countries.
To Read Now
Browse through "Access to drinking water around the world - in five infographics" by the Guardian, for a snapshot of international water issues.
UNICEF is an organization that fights for the rights of every child worldwide through advocacy and action. It is part of the United Nations and is the best known and most powerful child advocacy organization in the world. They perform research, publish reports, collect donations, and administer aid throughout the world.
- (OPTIONAL) "Drinking Water: Equity, safety, and sustainability." UNICEF. Browse through the section entitled "Social Disparities" (pp. 26 - 31). You do not have to read all of the content, but at least take a look at the charts provided. You are welcome to read the rest of the report as well.
What About Desalination?
Since about 97% of the water in the world is salt water, why can't we just desalinate (remove the salt from) this abundant source so we can use it for freshwater? Well, actually we can! This is done all over the world. According to the International Desalination Association, an industry organization, there are over 20,000 desalination plants in 150 countries that supply some 300 million people with at least part of their needs. Aha - problem solved! Wait, what's that you say? It is very energy intensive? It has negative environmental impacts? It is expensive? (You didn't think it would be that easy, did you?)
Desalination is a very promising technology, but it is not without its problems. You are welcome to read through the articles below, but the bottom line is that desalination plants, while a proven technology, require an immense amount of energy, can impact local environments in a variety of ways, and is quite expensive. Desalination is probably necessary to satisfy the world's energy needs (and likely increasingly so), particularly in arid areas of the world. But as succinctly stated by Scientific American: "Due to its high cost, energy intensiveness and overall ecological footprint, most environmental advocates view desalinization...as a last resort for providing fresh water to needy populations."
OPTIONAL Desalination Readings
The articles below provide a snapshot of domestic and international issues related to desalination. These are optional.
- "Lowering Desalination's Energy Footprint: Lessons from Israel." Environmental Defense Fund.
- "UNICEF seawater desalination plant helps head off Gaza water crisis." UNICEF.
- "The Impacts of Relying on Desalination for Water." Scientific American.
- "Desalination is an expensive energy hog, but improvements are on the way." PRI.
If you are interested in digging a little more deeply into the specific pros and cons of desalination, you can read through this article from Water Deeply. The author provides links to a lot of quality information sources.
Check Your Understanding
Optional Reading
Finally, Sandra Postel summarizes many of the issues outlined above, and provides additional insight into water sustainability issues in her book chapter in Is Sustainability Still Possible? This is optional but may be helpful.
- Chapter 5 of Is Sustainability Still Possible? pp. 51 - 59.
Optional (But Strongly Suggested)
Now that you have completed the content, I suggest going through the Learning Objectives Self-Check list at the top of the page.