As discussed in Chapter One, geographic data represent spatial locations (i.e., a feature) and non-spatial attributes measured at certain times. For instance, a city (a feature with a spatial location) can contain an endless number of attributes. Geographic data for a specific city may include attributes such as its population, the types of public transportation, and various land use patterns. Over recent years, software developers have created variations on standard query languages (SQL) that incorporate spatial queries. The dynamic nature of geographic phenomena complicates the issue further, however. The need to pose spatio-temporal queries challenges geographic information scientists (GIScientists) to develop ever more sophisticated ways to represent geographic phenomena, thereby enabling analysts to interrogate their data in more sophisticated ways.
4.1.1 Tables: Location versus Attribute
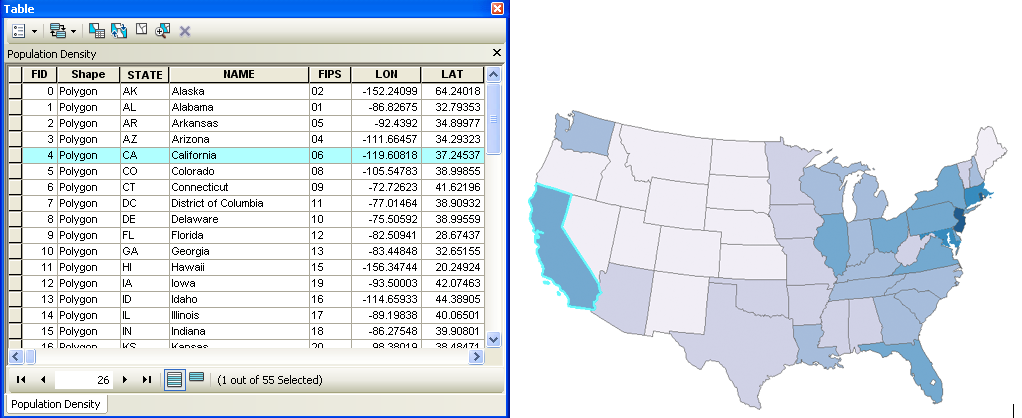
To explore the differences between a location and its attributes, view the table below of a geographic database originating from the U.S. Census Bureau and imported into ESRI’s ArcMap program. Each row in the attribute table refers to a feature’s location on the map, with numerous attributes associated with it. In this example, each object refers to a state that includes attribute data including information such as its FID (unique identifier), shape (polygon), state abbreviation, full state name, a FIPS code (unique code assigned to each state), and the longitude and latitude coordinates. As you can see, the fifth row highlighted in light blue is selected and the mapping program automatically links to the spatial representation of the state of California, also outlined in light blue. This functionality allows users to manipulate, query, and select features and their attributes in the table, while viewing changes dynamically on the map.